Total videos
32,443
TikTok + Reels, 2025Total views
1.010B
Short‑form onlyPeak month
February
242.8M viewsConcentration
Top 1% = 49.3%
Share of all viewsThis analysis shows how concentrated attention is, where the peaks landed, and how TikTok and Reels differ. We look at the short‑form output of Bundestag accounts across the full year.
We tracked 32,443 short‑form videos across TikTok and Instagram Reels in 2025 from verified political accounts. The year produced 1.010B views, 58.6M likes, 3.0M comments, and 4.74M shares. The top 1% of videos generated 49.3% of all views, and the top 0.1% still accounted for 16.0%.
Election week pulled the curve upward and explains a large share of the peaks. February became the dominant month of the year — not just for volume, but for engagement as well.
The election week (Feb 17–23, 2025) delivered 104.4M views — 10.3% of the year’s total — on 2,044 videos (6.3% of annual output). The single biggest day was February 22, 2025, with 31.7M views (3.1% of the entire year) across 399 videos.
This wasn’t a single viral spike. It was a stacked, multi‑day wave where posting volume and engagement rose together.
Short‑form attention is brutally concentrated. The top 1% of videos captured 49.3% of all views; the top 0.1% (roughly 33 videos) still accounted for 16.0%. On the creator side, the top 10 accounts produced 42.0% of all views (top 20: 57.2%).
The platform split shows where attention is steady and where breakouts happen.
Instagram Reels = the floor. It carries more volume and steadier output:
TikTok = the ceiling. Fewer videos, higher upside:
Two patterns explain the gap:
If you want the framework behind these metrics, start with our guide to social media engagement metrics.
Not every party (or politician) played the same platform game. Presence is uneven — and that changes the leaderboard.
That pattern matches external research. The Friedrich‑Ebert‑Stiftung’s Swipe, Like, Vote study analyzes 1,207 official TikTok videos (Jan 1–Feb 23, 2025) and shows why remixability beats raw reach: audio‑memes, edits, and “vibes” invite participation and secondary distribution. See the FES study page and the open‑access PDF.
Notably, Die Linke has the fewest accounts in the dataset, yet leads in total views. That’s why we separate total attention from efficiency (views per post, engagement per post). Volume alone doesn’t tell you who is winning — and account count doesn’t automatically explain the ranking.
At the top, it’s not just reach — it’s consistency and platform mix. Some parties dominate on views, others win on engagement, and that trade‑off reshapes the ranking.
Ranked by total 2025 views and average engagement rate across short‑form.
| Rank | Party | Total Views (2025) | Avg. Engagement Rate | Platform Strength |
|---|---|---|---|---|
| 1 | 301.1M | 8.45% | Instagram-heavy | |
| 2 | 195.5M | 7.75% | TikTok-heavy | |
| 3 | 193.2M | 6.24% | TikTok-heavy | |
| 4 | 185.6M | 5.22% | Instagram-heavy | |
| 5 | 134.4M | 2.95% | Instagram-heavy |
The most‑viewed clip is not always the most persuasive clip. We separate raw reach (views) from engagement quality (interaction per view) to avoid confusing visibility with impact.
@mirze_edis · Instagram · 11.39M views
@heidireichinnek · TikTok · Engagement rate: 13.69%
| Rank | Video | Platform | Views | Likes | Comments | Shares | Engagement Rate |
|---|---|---|---|---|---|---|---|
1 |  Zur #afd habe ich damit glaub ich alles gesagt. @mirze_edis | 11.39M | 96.8k | 9.2k | 3.9k | 0.96% | |
2 |  Die spontane Rede nach dem Dammbruch. @heidireichinnek | TikTok | 7.9M | 921k | 17.9k | 67.9k | 12.70% |
3 |  Jetzt gilts: Mindestens zwei Freunde mitnehmen… @alice_weidel_afd | TikTok | 7.6M | 571.6k | 46.8k | 67.6k | 9.02% |
4 |  Söder isst, Baerbock packt an!🚀 @boris.mijatovic | 7.4M | 64.1k | 855 | 300 | 0.89% | |
5 | 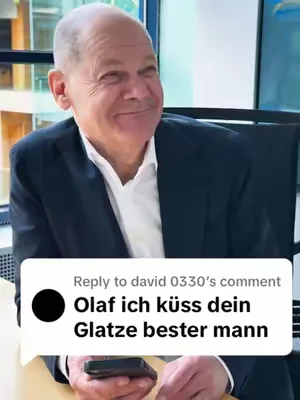 Replying to @david 0330 🥹 @teamolafscholz | TikTok | 7.0M | 472.5k | 14.2k | 137.8k | 8.91% |
6 | 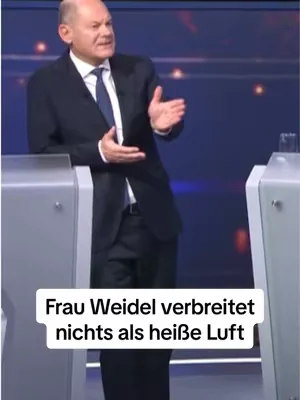 Gegenhalten! Die AfD hat kein Konzept. @teamolafscholz | TikTok | 6.8M | 641.7k | 16.2k | 77.2k | 10.78% |
7 |  Weniger Transparenz in der Tierhaltung… @zoe.gruene | 6.8M | 535.9k | 7.4k | 52.9k | 8.78% | |
8 | 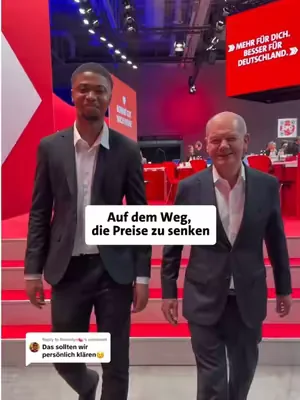 Replying to @Brooklyn🍉 Mehrwertsteuer senken 🤝 @teamolafscholz | TikTok | 5.9M | 594.7k | 9.8k | 110.4k | 12.19% |
9 |  ❤️🔥 In Neukölln lebt jedes dritte Kind in Armut. @der_neukoellner | 5.4M | 160.8k | 7.4k | 22.8k | 3.56% | |
10 |  Meine Accounts laufen weiter. @olafscholz | 5.3M | 143.3k | 2.6k | 2.1k | 2.81% |
Who pulls the most reach differs by platform. The tables show the top accounts by 2025 views, with engagement rate and video count included.
| Rank | Account | Party | Total Views (2025) | Avg. Engagement Rate | Videos |
|---|---|---|---|---|---|
1 |  @alice.weidel @alice.weidel | AfD | 69.5M | 5.77% | 108 |
2 |  @heidireichinnek @heidireichinnek | Die Linke | 31.0M | 7.62% | 35 |
3 |  @der_neukoellner @der_neukoellner | Die Linke | 29.1M | 5.50% | 82 |
4 |  @till_steffen @till_steffen | Bündnis 90/Die Grünen | 26.1M | 4.92% | 146 |
5 |  @merzcdu @merzcdu | CDU/CSU | 25.9M | 2.56% | 69 |
6 |  @zoe.gruene @zoe.gruene | Bündnis 90/Die Grünen | 25.2M | 7.92% | 106 |
7 |  @gregorgysi @gregorgysi | Die Linke | 23.2M | 6.37% | 38 |
8 |  @olafscholz @olafscholz | SPD | 21.9M | 2.82% | 57 |
9 |  @franziska.brantner @franziska.brantner | Bündnis 90/Die Grünen | 15.1M | 5.96% | 95 |
10 |  @mirze_edis @mirze_edis | Die Linke | 14.2M | 1.83% | 72 |
| Rank | Account | Party | Total Views (2025) | Avg. Engagement Rate | Videos |
|---|---|---|---|---|---|
1 |  @teamolafscholz @teamolafscholz | SPD | 88.7M | 9.00% | 137 |
2 |  @heidireichinnek @heidireichinnek | Die Linke | 63.3M | 14.13% | 110 |
3 |  @merzcdu @merzcdu | CDU/CSU | 33.0M | 3.35% | 100 |
4 |  @alice_weidel_afd @alice_weidel_afd | AfD | 32.1M | 9.67% | 112 |
5 |  @der_neukoellner @der_neukoellner | Die Linke | 19.4M | 9.66% | 108 |
6 |  @robinwagenermdb @robinwagenermdb | Bündnis 90/Die Grünen | 11.2M | 6.95% | 117 |
7 |  @gregorgysi48 @gregorgysi48 | Die Linke | 6.7M | 9.34% | 46 |
8 |  @juliakloeckner @juliakloeckner | CDU/CSU | 6.3M | 3.32% | 102 |
9 |  @lars.klingbeil @lars.klingbeil | SPD | 6.1M | 4.02% | 77 |
10 |  @muenzenmaier @muenzenmaier | AfD | 6.0M | 10.93% | 98 |
For a deeper benchmarking template, see our social media analytics report template and guide to social media campaign reporting.
If attention is this concentrated, winning requires systematic learning, not just posting. Track formats, watch competitors, adapt what works, and run experiments with clear learnings each cycle. That’s what viral.app is built for: making formats, accounts, and platforms comparable so teams can iterate faster.
Discover the 9 essential short-form video trends for 2025, from AI-driven content and shoppable videos to micro-storytelling.
Mike Schneider
Co-Founder
Break down the view counts, engagement ratios, and growth plays that define modern virality across TikTok, YouTube, Instagram, and more.
Mike Schneider
Co-Founder
Try without risk with our 7-day free trial.
Go based on data, not by luck.
Pay everyone on your own terms.
Eliminate hours of manual work.
Pay $0 today · Cancel anytime


