Questions & Answers
We're here to help you get the most out of viral.app.
From Reach to ROI, master the KPIs that truly matter for platform growth on TikTok, Instagram, and YouTube.

Want to boost your brand's performance on social media? This listicle reveals the crucial social media engagement metrics you need to track in 2025. Whether you're a consumer brand, an agency managing TikTok or Instagram, or an ecommerce business, understanding these metrics is key to optimizing your strategies and achieving real results. Learn how to measure Engagement Rate, Reach, Impressions, Click-Through Rate (CTR), Social Share/Amplification Rate, Save Rate, Comments and Replies Rate, Follower Growth Rate, and Social Media Conversion Rate. Mastering these social media engagement metrics empowers data-driven decisions, maximizing your reach and boosting community engagement. To effectively document these metrics, it's best to use professional reporting templates.
Engagement rate is the cornerstone of social media analytics. This fundamental metric reveals the percentage of your audience actively interacting with your content—through likes, comments, shares, saves, and clicks. It provides a quantifiable measure of how well your content resonates with your target audience and spurs meaningful interactions, essentially acting as a pulse check for your social media presence. It deserves its place at the top of any social media metrics list because it offers a direct line of sight into content effectiveness and audience connection.
Calculating engagement rate involves dividing the total number of engagements a post receives by your total followers (or reach/impressions) and then multiplying by 100. While seemingly simple, understanding the nuances of this calculation is crucial for accurate interpretation. There are multiple calculation methods—using followers, reach, or impressions—each offering slightly different perspectives. Calculating by followers provides a general overview of how your existing audience interacts with your content. Using reach, which represents the number of unique users who saw your content, offers a more accurate picture of your content's impact. Impressions, reflecting the total number of times your content was displayed, can be helpful in understanding the potential for engagement, although it can inflate the perceived success if the same users see the content multiple times without interacting.
One of the strengths of engagement rate is its platform-agnostic nature. Whether you're analyzing performance on Instagram, Facebook, TikTok, Twitter, or LinkedIn, engagement rate offers a consistent measure for comparison. This facilitates cross-platform analysis and allows you to pinpoint which channels are most effective in driving audience interaction. Real-time tracking capabilities further enhance the value of this metric, enabling you to monitor performance and identify trends as they emerge. By analyzing engagement rates comparatively across different content pieces, you gain invaluable insights into what resonates with your audience and can tailor future content accordingly. Furthermore, engagement rate serves as a crucial indicator of audience quality, going beyond vanity metrics like follower count to reveal the level of genuine interest and interaction.
There are clear advantages to tracking engagement rate. It provides a concise snapshot of content effectiveness, enabling data-driven decision-making. It’s easy to calculate and understand, even for those new to social media analytics. Tracking engagement rate helps identify high-performing content types, informing your content strategy and maximizing your efforts. It serves as a valuable tool for benchmarking against competitors, offering insights into industry best practices and identifying areas for improvement. Critically, a strong engagement rate correlates directly with improved algorithm visibility. Social media platforms prioritize content that generates high engagement, leading to increased organic reach and wider distribution.
However, engagement rate also has its limitations. If calculated incorrectly, using the wrong denominator (followers vs. reach) for instance, it can lead to misleading conclusions. It's crucial to be mindful of the significant variations in engagement rates between platforms. A 2% engagement rate on Instagram might be considered good, while the same percentage on TikTok could be seen as underperforming. Another important caveat is that engagement rate may not always reflect actual business impact. While high engagement is generally positive, it doesn't automatically translate into increased sales or conversions. Finally, engagement rate can be artificially inflated by engagement pods, groups of users who agree to interact with each other's content, creating a false sense of popularity.
Examples of successful engagement rate implementation abound. Netflix consistently achieves 3-6% engagement rates through witty, relatable content tailored to its target audience. National Geographic maintains impressive 8-12% rates with stunning visual storytelling that captivates its followers. Wendy's viral Twitter strategy, known for its humorous and often provocative approach, generates remarkable 15-20% engagement rates. These examples demonstrate the power of a well-defined social media strategy focused on driving genuine interaction.
To maximize the value of engagement rate, consider these actionable tips: Calculate using reach rather than followers for a more accurate measurement. Track engagement rate trends over time, rather than fixating on individual posts, to identify consistent patterns. Set platform-specific benchmarks (Instagram: 1-3%, Facebook: 0.5-1%, TikTok: 5-10%) to contextualize your performance. Use engagement rate data to optimize posting times and experiment with various content formats. Above all, prioritize meaningful interactions over vanity metrics, focusing on building a community of genuinely engaged followers.
The following infographic visualizes average engagement rate benchmarks across three key platforms: Instagram, Facebook, and TikTok.
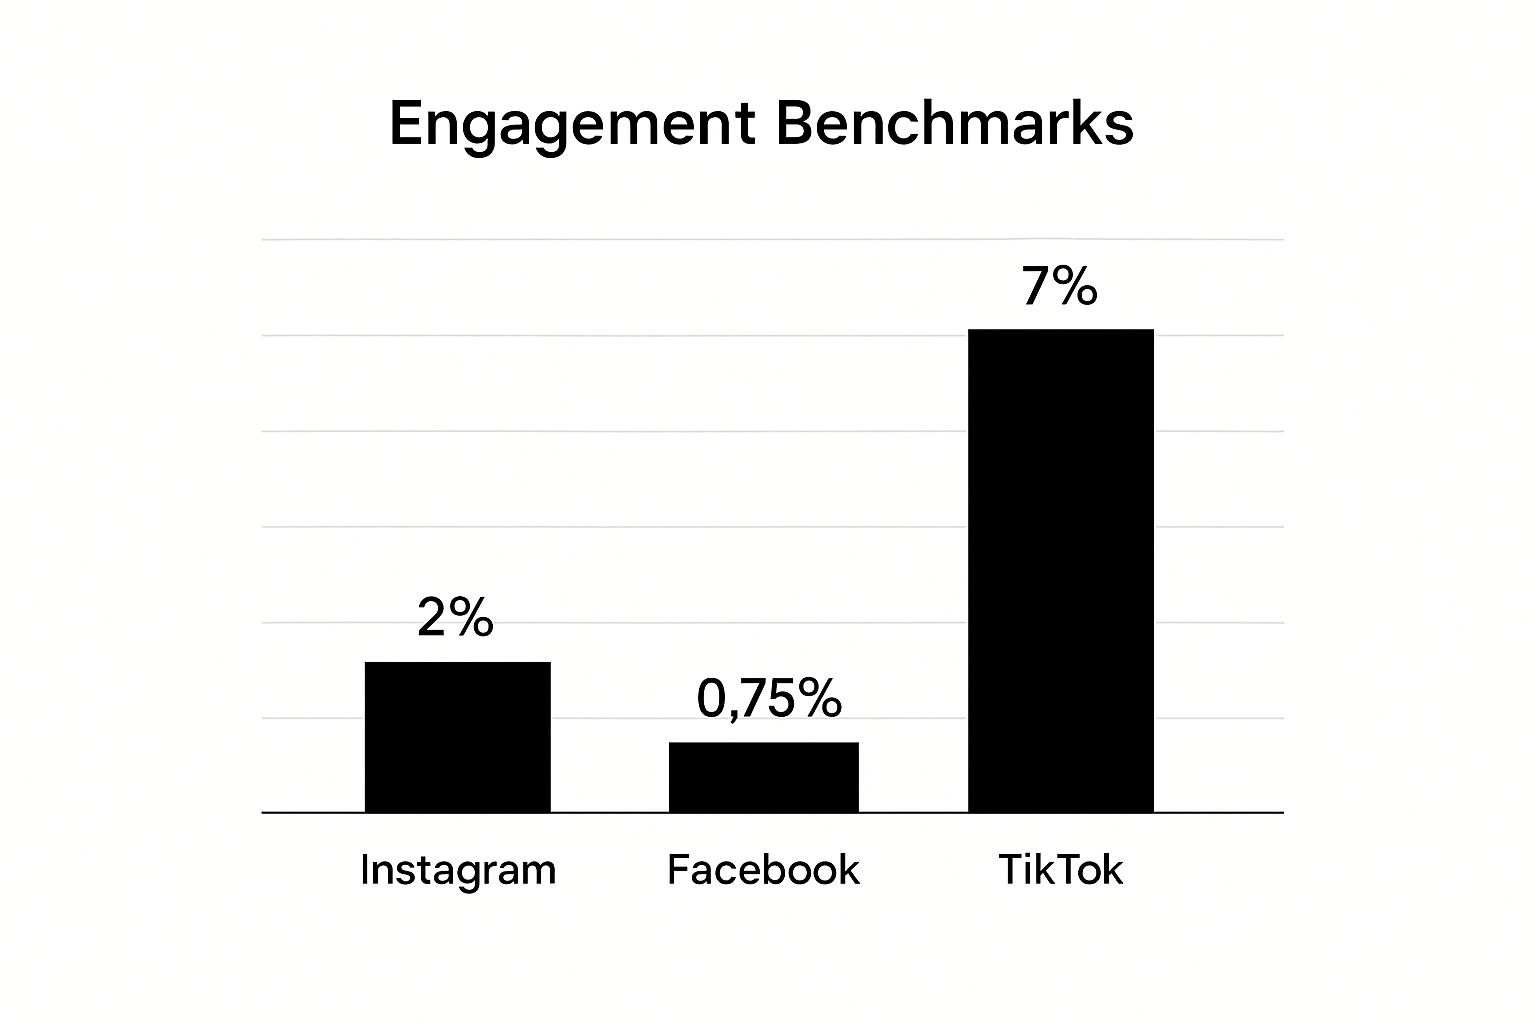
As the bar chart illustrates, TikTok boasts significantly higher average engagement rates (7%) compared to Instagram (2%) and Facebook (0.75%). This highlights the platform's unique ability to foster interaction and engagement among its user base.
Reach and impressions are two fundamental social media engagement metrics that provide crucial insights into the visibility of your content. While often used interchangeably, they represent distinct aspects of content distribution. Understanding the difference between these two metrics, and how they work together, is vital for optimizing your social media strategy and maximizing your brand's impact. Reach refers to the number of unique users who have seen your content. Think of it as the number of individual people your message has touched. Impressions, on the other hand, represent the total number of times your content has been displayed, regardless of whether it was seen by the same user multiple times. Essentially, every time your content appears on a screen, it counts as an impression.

Together, reach and impressions offer a comprehensive view of your content's performance. They provide insight into how effectively your content is being distributed and the extent of your audience exposure. For example, high reach with low impressions suggests your content is being seen by a wide audience but not being viewed repeatedly. Conversely, high impressions with low reach might indicate that a smaller group of users is interacting with your content multiple times. This information is incredibly valuable for tailoring your content strategy, understanding audience behavior, and measuring the success of your campaigns.
Reach and impressions data are typically categorized into organic and paid. Organic reach represents the number of unique users who saw your content without any paid promotion, reflecting the natural visibility of your posts. Paid reach, as the name suggests, refers to the unique users reached through sponsored posts or advertisements. Analyzing both organic and paid reach helps you understand the effectiveness of your organic content strategy and the ROI of your advertising spend.
Several features enhance the utility of reach and impressions data. Calculating the frequency (impressions ÷ reach) helps determine the average number of times a user has seen your content. This is critical for avoiding audience fatigue. Geographic and demographic breakdowns allow you to understand which audience segments are engaging with your content, enabling targeted campaigns. Time-based analysis reveals optimal posting times for maximizing reach. Furthermore, cross-platform measurement standardization is becoming increasingly important as brands maintain a presence across multiple social media channels.
The benefits of tracking reach and impressions are numerous. These metrics are essential for measuring brand awareness and content visibility, informing content distribution strategies, calculating other important metrics like cost per mille (CPM), and indicating algorithm performance and content quality. They are also fundamental for media planning and budget allocation. For instance, understanding which type of content generates the highest reach can guide your investment in specific content formats or themes.
However, these metrics also have their limitations. High reach doesn’t guarantee engagement or conversions. A large audience exposed to your content doesn’t necessarily translate into likes, comments, shares, or purchases. Impression numbers can be inflated by bot traffic, providing a skewed picture of actual human interaction. Variations in platform definitions of reach and impressions can also complicate cross-platform comparisons. Furthermore, the declining organic reach across most platforms necessitates a deeper understanding of algorithm dynamics and strategic content planning. Finally, reach and impressions may not accurately reflect actual attention or recall. Just because a user’s screen displayed your content doesn't mean they actively engaged with it or remember it.
Several successful brands have leveraged reach and impressions to drive their social media strategies. Coca-Cola's 'Share a Coke' campaign, which personalized Coke bottles with individual names, achieved over 500 million impressions globally, contributing significantly to brand awareness and engagement. Airbnb's user-generated content strategy, showcasing unique travel experiences, reaches over 50 million unique users monthly, building a strong community and driving bookings. Red Bull's focus on extreme sports content generates over 100 million monthly impressions, reinforcing its brand image and attracting a highly engaged target audience.
To effectively utilize reach and impressions data, consider the following tips: Monitor reach-to-follower ratios to assess algorithm performance and identify areas for improvement. Use frequency data to avoid audience fatigue – generally, aim for a frequency of 3-4 or less. Track reach growth rate alongside follower growth to understand the true reach of your content beyond your existing audience. Optimize posting times using reach data insights. Finally, combine organic and paid strategies for maximum reach efficiency, ensuring your message reaches the widest possible audience. By understanding and implementing these strategies, businesses can harness the power of reach and impressions to drive significant improvements in their social media performance.
Click-Through Rate (CTR) is a pivotal social media engagement metric that measures the effectiveness of your content in driving traffic to external destinations. It quantifies the percentage of users who click on a specific link within your social media content. The calculation is straightforward: divide the total number of clicks on a link by the total number of impressions (or reach) that the content received, then multiply by 100 to express it as a percentage. CTR is a crucial component of any conversion-focused social media strategy, as it directly reflects how well your content compels users to take the desired action of visiting your website, landing page, or product page.

This metric goes beyond simple engagement metrics like likes or comments. While those indicate surface-level interaction, CTR provides deeper insights into the quality of that engagement. It signifies genuine interest and a willingness to explore beyond the social media platform itself. For businesses, this translates to potential leads, conversions, and ultimately, revenue. CTR's prominence in social media analytics stems from its direct correlation with achieving tangible business objectives. It earns its place in the list of essential social media engagement metrics because it bridges the gap between social media presence and business outcomes.
CTR offers several powerful features for in-depth analysis and optimization. Modern social media analytics platforms provide link tracking and attribution capabilities, allowing you to precisely measure the source of your traffic. Integrating UTM parameters further refines this tracking, providing granular data on the specific campaigns and channels driving clicks. A/B testing compatibility allows for systematic optimization of your content and CTAs, while cross-platform performance comparison helps identify which channels are most effective for your target audience. Real-time monitoring and alerts enable you to react quickly to trends and optimize your strategy on the fly.
Several factors contribute to a successful CTR strategy. Compelling headlines and preview text are essential for grabbing attention and enticing users to click. Strategic link placement within captions and stories maximizes visibility and encourages interaction. Testing different CTA phrases and button placements allows for optimization based on user behavior. Monitoring CTR by content type helps identify high-performing content formats and tailor future strategies. For platforms with limited link options, link-in-bio tools are invaluable for directing users to multiple destinations.
Several well-known brands exemplify the power of a strong CTR strategy. HubSpot, for instance, consistently achieves a 2-4% CTR through its educational content and clear calls-to-action. Amazon leverages strategic timing and product showcase posts to generate CTRs between 3-5%. BuzzFeed's mastery of curiosity-driven headlines routinely yields impressive 4-6% CTR rates. These examples highlight the potential of CTR optimization across diverse industries and content strategies.
However, CTR also has its limitations. Platform restrictions may limit link usage in certain contexts. Click fraud and bot traffic can artificially inflate CTR numbers, skewing the data. A high CTR doesn't guarantee meaningful engagement on the destination website; users might quickly leave after clicking. Lower CTRs on mobile devices are common due to differing user behavior. Finally, CTR may not fully capture the benefits of brand awareness generated through social media.
Despite these limitations, the pros of tracking CTR significantly outweigh the cons. It provides a direct measure of traffic generation effectiveness and serves as a strong indicator of content relevance and appeal. CTR helps optimize call-to-action strategies and provides valuable data for ROI calculations and budget justification. Most importantly, it strongly correlates with conversion potential, making it a key metric for any business seeking to drive tangible results from its social media presence.
Whether you're a consumer brand, an ecommerce business, or a TikTok/Instagram agency, understanding and optimizing your CTR is crucial for maximizing the impact of your social media efforts. By implementing the tips outlined above and closely monitoring your performance, you can leverage the power of CTR to drive traffic, generate leads, and ultimately achieve your business objectives. By actively analyzing and optimizing your CTR, you gain a competitive edge in the ever-evolving social media landscape.
Social share/amplification rate is a crucial social media engagement metric that provides valuable insights into the virality and overall effectiveness of your content. It measures the percentage of users who actively share your content with their own networks, essentially amplifying your message and extending its reach organically. This metric is calculated by dividing the total number of shares by your total followers or reach. Unlike other engagement metrics like likes or comments, which indicate passive engagement, the share rate reflects a deeper level of engagement – a conscious decision by the user to endorse your content and associate it with their personal brand. Understanding and optimizing your social share rate is essential for any brand or agency seeking to maximize their impact on social media platforms. It's particularly relevant for Consumer Apps, TikTok Agencies, Consumer Brands, Instagram Agencies, and Ecommerce businesses, where organic reach and brand building are paramount.
This metric goes beyond simple visibility; it's a measure of how resonant and valuable your audience finds your content. A high share rate signifies that your content is not only engaging but also compelling enough for users to want to broadcast it to their connections. This voluntary act of sharing translates into increased brand visibility, enhanced credibility through social proof, and the potential for viral growth. It's a cost-effective way to amplify your message and reach a wider audience without relying solely on paid advertising.
How It Works:
The calculation is straightforward:
Social Share Rate = (Total Number of Shares / Total Followers or Reach) * 100
For example, if a post receives 100 shares and your account has 10,000 followers, your social share rate is 1%. While this might seem low compared to other engagement metrics, remember that sharing represents a much more active and deliberate form of engagement.
Features and Benefits:
Effective tracking and analysis of social share rates often involve several key features:
Pros:
Cons:
Examples of Successful Implementation:
Tips for Increasing Social Share Rates:
By understanding the nuances of social share/amplification rate and implementing these tips, brands and agencies can significantly improve their content performance, expand their organic reach, and build a stronger brand presence on social media.
In the bustling world of social media, where likes and comments often steal the spotlight, a quieter yet potent metric emerges as a key indicator of content value: the save rate. This often-overlooked engagement metric represents the percentage of users who save your content for later viewing, essentially bookmarking it as a valuable resource. It's calculated by dividing the total number of saves by the total impressions or reach of your post. For businesses, agencies, and influencers aiming to establish long-term engagement and build a loyal audience, understanding and leveraging the save rate is crucial for social media success.
Save rate is particularly significant on visually-driven platforms like Instagram, Pinterest, and increasingly, LinkedIn. Unlike fleeting likes or comments, saving a post signifies a deeper level of engagement. It indicates that the user found your content valuable enough to revisit later, suggesting a higher level of interest and potential for long-term impact. This metric transcends surface-level interactions and delves into the realm of genuine user intent. When a user saves your content, they're not just passively consuming it; they're actively choosing to keep it for future reference, demonstrating a desire to engage with your brand or message beyond the immediate moment.
Why Save Rate Deserves Its Place Among Social Media Engagement Metrics:
In a landscape saturated with content, the save rate stands out as a metric that reflects genuine value and utility. It provides insights beyond vanity metrics, offering a glimpse into how users truly perceive and interact with your content. Here's why it's essential:
Content Longevity Indicator: A high save rate suggests your content has lasting value. It’s not just consumed and forgotten; it’s considered a resource worth revisiting. This indicates the potential for your content to continue generating engagement and driving traffic over time, contributing to a more sustainable social media strategy.
User Intent Measurement: Saves provide a clearer picture of user intent than likes or comments. A like can be a fleeting gesture, but a save signals a deliberate decision to return to your content later. This helps you understand what resonates with your audience and tailor future content accordingly.
Algorithm Boost Factor: Social media algorithms, particularly on platforms like Instagram, interpret saves as a strong signal of content quality. A higher save rate can positively influence your content's visibility and reach, boosting organic growth and expanding your audience.
Content Utility Assessment: Save rate is a powerful tool for assessing the practical usefulness of your content. Are you providing information, tips, or resources that people find genuinely helpful? The save rate provides a direct answer.
Examples of Successful Implementation:
Several brands and influencers have effectively leveraged the power of save-worthy content to drive engagement and build their following. For example:
Tasty's recipe videos: By providing easy-to-follow cooking instructions and visually appealing food content, Tasty consistently achieves save rates of 8-12% on Instagram. Users save these videos to try the recipes later, demonstrating the practical value of their content.
Canva's design tip posts: Canva utilizes carousel posts to share bite-sized design tips and tutorials. These highly saveable posts generate 5-10% save rates, positioning Canva as a valuable resource for designers and marketers.
Marie Kondo's organization content: Marie Kondo's posts on decluttering and organizing resonate deeply with her audience, leading to save rates of 10-15%. Users save her tips and techniques for future reference, highlighting the long-term value of her content.
Actionable Tips for Increasing Your Save Rate:
Boosting your save rate requires a strategic approach focused on creating genuinely valuable and shareable content. Here are some actionable tips:
Create comprehensive, reference-worthy content: Focus on providing in-depth information, tutorials, tips, and resources that users will want to revisit.
Use carousel posts to provide step-by-step guides: Carousel posts are highly effective for delivering valuable information in an easily digestible format.
Include save-worthy elements like tips, recipes, or tutorials: Make your content practical and actionable by incorporating elements users will want to save for later use.
Add "save this post" CTAs in captions: Encourage users to save your content by explicitly prompting them in your captions.
Track which content types generate the highest save rates: Analyze your performance to identify what resonates most with your audience and refine your content strategy accordingly.
Pros and Cons of Focusing on Save Rate:
While save rate is a valuable metric, it's important to be aware of its limitations:
Pros:
Cons:
Despite these limitations, the save rate remains a crucial metric for understanding true audience engagement and building a loyal following. By focusing on creating valuable, save-worthy content, you can establish your brand as a go-to resource within your niche and cultivate a community of engaged followers.
Comments and replies rate is a crucial social media engagement metric that goes beyond superficial interactions and delves into the depth of audience connection with your content. While likes and shares offer a quick pulse check on content popularity, the comments and replies rate provides a more nuanced understanding of how your audience truly engages and invests in your brand. This metric measures the percentage of your audience that actively participates in discussions by leaving comments on your posts. It's calculated by dividing the total number of comments (including replies) by your total followers or reach. This distinction is important because it signifies a more substantial commitment from your audience compared to passive actions like liking or sharing. Commenting requires more effort and thought, indicating a stronger connection with your brand and message. Tracking this metric is essential for consumer apps, TikTok agencies, consumer brands, Instagram agencies, and e-commerce businesses seeking to cultivate thriving online communities.
How it Works and Why it Matters:
The comments and replies rate reveals the extent to which your content sparks conversation and fosters a sense of community. A higher rate suggests that your content resonates deeply with your audience, prompting them to share their thoughts, opinions, and experiences. This metric also provides valuable insights into audience sentiment, allowing you to understand what aspects of your content are most engaging and what topics spark the most discussion. This feedback is invaluable for refining your content strategy and tailoring your messaging to better resonate with your target audience. For businesses, a high comments and replies rate signifies a strong brand-customer relationship, fosters brand loyalty, and can even lead to increased sales conversions.
Features that Enhance Comment Analysis:
Several features can enhance your analysis of comments and replies, providing a more comprehensive understanding of audience engagement. These include:
Examples of Successful Implementation:
Several brands have effectively leveraged comments and replies to build thriving online communities.
Actionable Tips for Boosting Your Comments and Replies Rate:
When and Why to Use This Approach:
Tracking and analyzing your comments and replies rate is essential for any brand or individual seeking to build a strong online community. It's particularly important for:
By prioritizing comments and replies as a key engagement metric, you can move beyond superficial interactions and cultivate a truly engaged and vibrant online community.
Follower growth rate is a crucial social media engagement metric that measures the percentage increase in your followers over a specific period. This metric provides valuable insights into the effectiveness of your social media strategy, brand awareness growth, content appeal, and your ability to attract and retain an audience. For consumer apps, TikTok and Instagram agencies, consumer brands, and eCommerce businesses, understanding and tracking follower growth rate is essential for sustained success in the competitive social media landscape.
Calculating follower growth rate is straightforward. Divide the number of new followers gained during a specific period by your starting follower count at the beginning of that period. Then, multiply the result by 100 to express it as a percentage. For example, if you started with 1,000 followers and gained 100 new followers in a month, your follower growth rate for that month would be (100/1,000) * 100 = 10%.
This metric's flexibility allows for analysis across various timeframes, from daily and weekly to monthly and quarterly, offering granular insights into growth patterns. Furthermore, you can differentiate between organic follower growth, achieved through compelling content and community engagement, and paid growth, resulting from advertising campaigns. This distinction is critical for understanding the true effectiveness of your organic content strategy.
Why is Follower Growth Rate Important?
Follower growth rate deserves a prominent place among social media engagement metrics because it offers several key benefits:
Features and Tools for Analyzing Follower Growth Rate:
Several features and tools can enhance your follower growth rate analysis:
Pros and Cons of Focusing on Follower Growth Rate:
While follower growth rate is a valuable metric, it's important to be aware of its limitations:
Pros:
Cons:
Examples of Successful Follower Growth:
Several brands and individuals have achieved remarkable follower growth rates:
Tips for Optimizing Follower Growth Rate:
By understanding and effectively utilizing follower growth rate as a key social media engagement metric, you can refine your strategies, optimize content creation, and achieve sustainable growth across various platforms. Remember that while follower count is an important indicator, focusing on building a genuine and engaged community will ultimately drive long-term success.
Social media conversion rate is a critical metric that measures the effectiveness of your social media efforts in driving tangible business outcomes. It represents the percentage of social media users who complete a desired action – a conversion – after engaging with your content. These actions can range from making a purchase and signing up for a newsletter to downloading a resource or requesting a demo. Calculating your social media conversion rate involves dividing the number of conversions by the total clicks or visits originating from social media platforms. This metric provides a clear link between your social media activities and your return on investment (ROI), making it essential for assessing the actual business impact of your social media strategy. In a landscape saturated with vanity metrics like likes and shares, conversion rate stands out as a true measure of success. For consumer apps, TikTok agencies, consumer brands, Instagram agencies, and e-commerce businesses alike, understanding and optimizing this metric is paramount to achieving business objectives.
This metric works by tracking user behavior from the initial interaction on a social media platform through to the completion of the desired action on your website or app. This tracking is often facilitated through tools like UTM parameters (unique codes appended to URLs) and pixels (small pieces of code placed on your website) that allow you to attribute conversions back to specific social media campaigns, posts, or even individual ads. By understanding which social media activities are driving the most conversions, you can refine your strategy, allocate your budget more effectively, and ultimately maximize your ROI.
Features of robust conversion rate tracking often include:
Pros of Tracking Social Media Conversion Rate:
Cons of Tracking Social Media Conversion Rate:
Examples of Successful Implementation:
Tips for Optimizing Social Media Conversion Rates:
Social media conversion rate deserves its place among key engagement metrics because it moves beyond vanity metrics and focuses on tangible business results. By understanding and optimizing this metric, businesses can effectively leverage social media to drive real growth and achieve their business objectives. While setting up robust tracking requires effort, the insights gained are invaluable for making data-driven decisions and maximizing the ROI of your social media marketing.
| Metric | Implementation Complexity | Resource Requirements | Expected Outcomes | Ideal Use Cases | Key Advantages |
|---|---|---|---|---|---|
| Engagement Rate | Low | Minimal data tracking tools | Measures audience interaction quality | Content performance analysis | Easy to calculate; correlates with visibility |
| Reach and Impressions | Medium | Analytics platforms required | Measures content visibility and brand awareness | Media planning and content distribution | Differentiates organic vs. paid reach |
| Click-Through Rate (CTR) | Medium-High | Link tracking and UTM setup | Measures traffic driven to external links | Conversion-focused campaigns | Directly tracks traffic; useful for ROI |
| Social Share/Amplification Rate | Medium | Sharing analytics tools | Measures content virality and organic reach | Viral content and brand credibility | Cost-effective visibility boost |
| Save Rate | Low-Medium | Platform-specific tracking | Indicates content value and utility | Educational and evergreen content | Signals deep engagement; algorithm boost |
| Comments and Replies Rate | Medium-High | Moderation and sentiment tools | Measures community engagement depth | Community building and feedback | Builds relationships; increases visibility |
| Follower Growth Rate | Medium | Follower analytics | Measures brand awareness growth | Audience growth strategies | Clear growth insight; benchmarks easily tracked |
| Social Media Conversion Rate | High | Advanced tracking setup | Measures actual business impact and ROI | Sales and lead generation | Directly ties social efforts to revenue |
Mastering social media engagement metrics is crucial for success in today's digital landscape. From understanding your engagement rate and reach to tracking your click-through rate (CTR), social share/amplification rate, save rate, comments and replies rate, follower growth rate, and ultimately, your social media conversion rate, these key performance indicators (KPIs) provide a comprehensive view of your content's performance. By analyzing these metrics, you gain actionable insights into what resonates with your audience, allowing you to refine your strategy, optimize your content, and maximize your impact across platforms like TikTok, Instagram, and YouTube. Understanding these social media engagement metrics empowers you to make data-driven decisions that drive real business outcomes, whether you're a consumer app, a TikTok or Instagram agency, a consumer brand, or an eCommerce business.
The value of mastering these concepts goes beyond simply accumulating likes and followers. It’s about fostering genuine connections, building a loyal community, and ultimately, achieving your business objectives. By understanding how your audience interacts with your content, you can tailor your approach to better meet their needs and desires, resulting in stronger engagement, increased brand loyalty, and sustainable growth. In the ever-evolving world of social media, staying ahead of the curve is essential, and a deep understanding of these metrics is your key to unlocking long-term success.
Ready to elevate your social media strategy and unlock the full potential of your content? viral.app provides the tools you need to effectively track and analyze your social media engagement metrics, offering comprehensive insights into your performance across key platforms. Sign up for viral.app today and discover how you can transform your social media presence into a powerful engine for growth.
We're here to help you get the most out of viral.app.
Become an expert in UGC marketing today leveraging our industry knowledge and unique tools.
Keep your own content analytics clean while still tracking what competitors are doing

Build custom workflows and integrations with programmatic access to your analytics
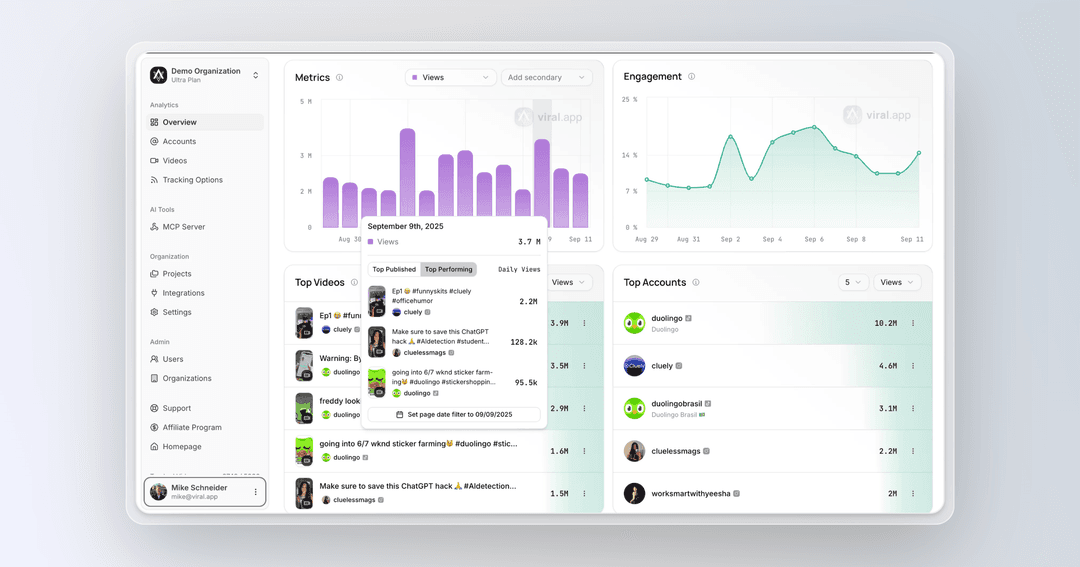
Track how single videos go viral with detailed performance insights and daily top performer breakdowns

UGC-Marketing with the ultimate growth-pilot.