Questions & Answers
We're here to help you get the most out of viral.app.
Stop tracking vanity metrics. Learn to create reports that measure real business impact and drive campaign success.

I've looked at hundreds of social media campaign reports, and honestly? Most marketers are tracking everything except what actually matters. We get caught up in vanity metrics—likes, shares, follower counts—that make us feel productive, but often hide a lack of real business impact. I've talked to so many marketing directors who've been burned by impressive-looking reports that didn't actually help the bottom line. These conversations showed a big disconnect: the reports looked great, but they weren't tied to real business goals.
For example, one director told me about a campaign that bragged about a 20% increase in engagement, but actually led to fewer leads. Why? The engagement wasn't leading to valuable actions like website visits or sign-ups. This is metric theater: focusing on metrics that look good instead of those that actually matter. It’s easy to fall into this trap, especially when you need to show “results.” We focus on what’s easy to measure, not what's important.
This isn't just about individual marketers; it's a widespread problem. Everyone wants clear, actionable insights from social media campaign reports, but there's a growing gap between what marketing leaders expect and what teams can deliver. Surveys show 65% of leaders want direct connections between social media campaigns and business goals, but only 30% of marketers feel confident measuring social media ROI. Discover more insights on social media ROI. This difference highlights the need for a better approach to reporting.
So, how do successful brands avoid this? They focus on insights that directly relate to business goals, not surface-level metrics. Instead of celebrating high reach, they analyze how that reach turned into website traffic. Instead of obsessing over likes, they track how many likes became leads. This means a fundamental change in mindset—from tracking activity to measuring impact.
This change starts by setting clear, measurable objectives for every campaign. What specific business outcome are you aiming for? Increased sales? More qualified leads? Greater brand awareness? Once you know your objectives, you can identify the key performance indicators (KPIs) that show progress toward those goals. This is where tools like viral.app become incredibly helpful, giving you detailed data to track the metrics that truly matter for your business. By connecting your social media campaign reporting with your business objectives, you'll go beyond surface-level metrics and start getting insights that drive real, measurable results.
Let's face it, setting up reporting isn't the glamorous part of social media. We all want to jump into those colorful dashboards – I'm right there with you! But neglecting the groundwork is like building a house on sand. It might look okay initially, but trust me, it’s going to come crashing down. I’ve learned this lesson the hard way, and after talking with tons of marketing ops specialists, I know a solid setup can completely change your reporting game.
One key thing is using UTM parameters the right way. These little tags you add to your URLs are like tiny spies, telling you exactly where your traffic is coming from. I’m talking specific campaigns, ads, even individual keywords. Knowing someone came from Facebook isn’t enough anymore. You need to know which post on Facebook made them click. This granular data is gold for understanding what your audience loves and tweaking your campaigns to perform even better.
Just as important is getting your conversion tracking dialed in. This means setting up your analytics platform (Google Analytics is a popular choice) to capture the whole customer journey. From that initial social media click all the way to the final purchase. This gives you a complete picture of how your campaigns are doing and the real impact of your social media work. You can actually see how many people who clicked on that Instagram ad ended up buying something on your website. For more hands-on tips about setting up effective tracking, check out our guide on social media analytics report templates.

This screenshot from Google Analytics shows you how to visualize your social media campaign data. Looking at metrics like users, sessions, and conversion rate gives you valuable insights into which platforms and campaigns are bringing in the most valuable traffic. This helps you spend your budget and resources wisely, focusing on the channels that deliver the best bang for your buck.
Finally, and this is the most important part: your tracking has to match your business goals. What are you actually trying to achieve with your social media? Brand awareness? Leads? Direct sales? Your reporting setup should reflect those goals. This might seem obvious, but I’ve seen so many reports packed with impressive-looking metrics that don’t actually help the business grow. By aligning your reporting with your business objectives right from the start, you make sure your data isn’t just accurate, it’s actually useful and actionable. This foundation will set you up for social media campaign reporting that truly delivers results.
Running campaigns across multiple social media platforms? Then you know the reporting struggle is real. Each platform boasts its own unique metrics, making a unified view of performance feel like a distant dream. It's like piecing together a puzzle where every piece is from a different box – frustrating and incredibly time-consuming. I've been there, trust me, spending hours wrestling data from different dashboards, only to uncover discrepancies thanks to those pesky varying attribution windows.
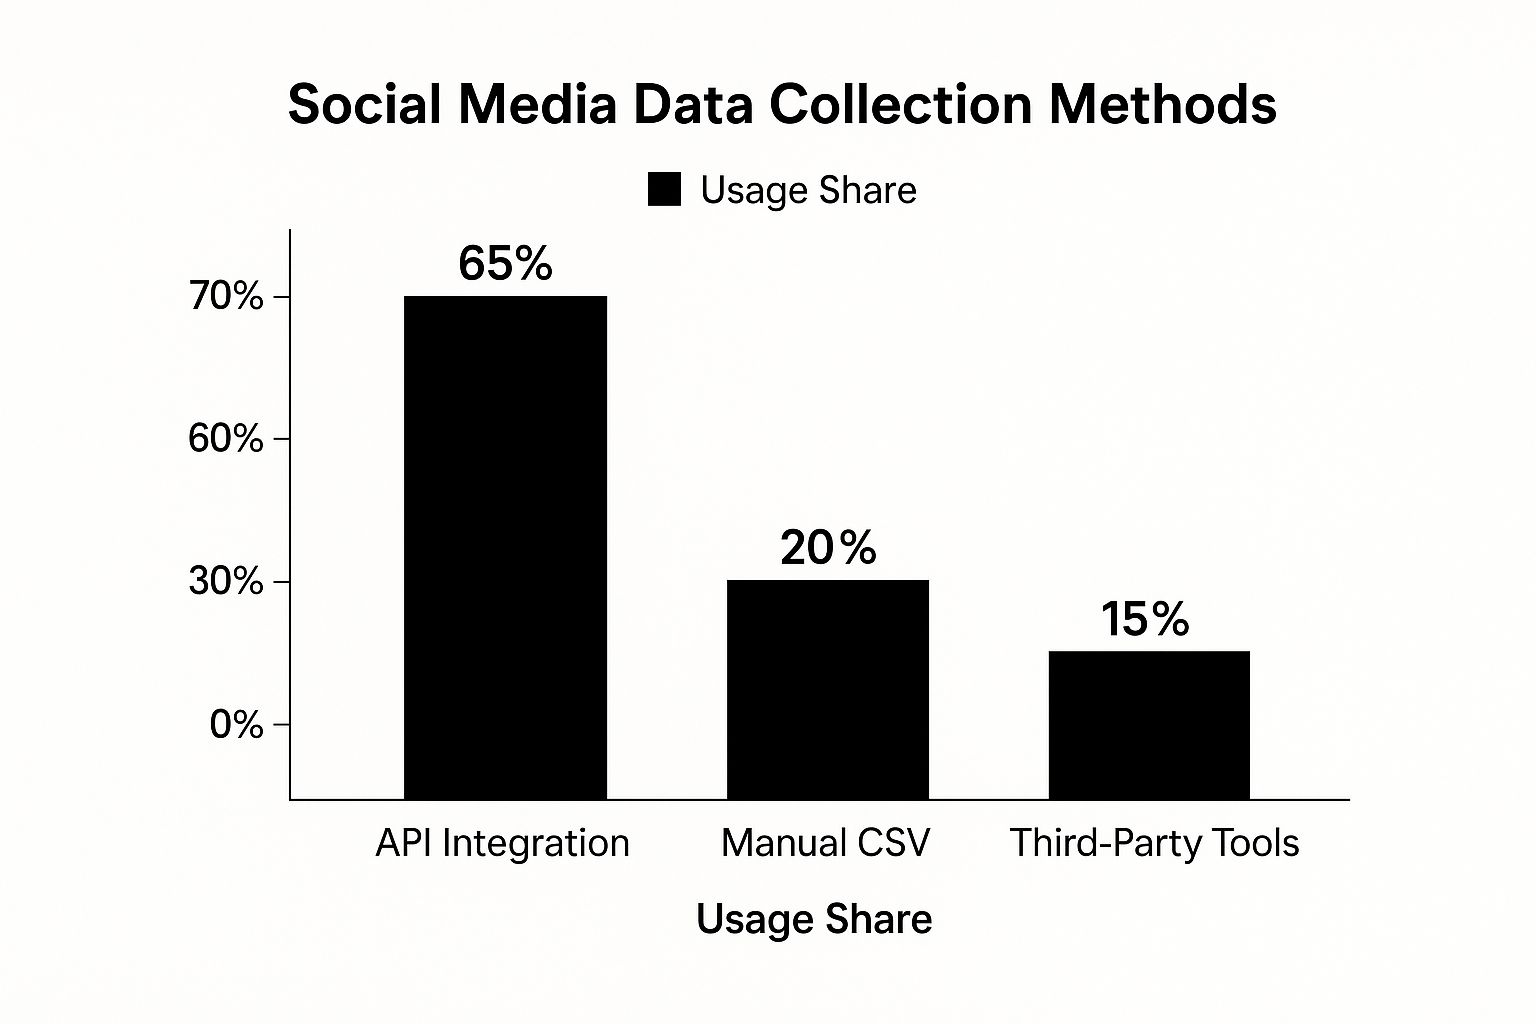
This infographic shows how most people are currently gathering social media data. API integration is king at 65%, which isn't surprising given how vital it is for efficient data retrieval. Manual CSV exports and third-party tools have their place, sure, but they're definitely less popular. This just reinforces why prioritizing API integration is key for accurate and efficient reporting. When building your reporting foundation, remember to keep your overall business goals in mind and truly understand your target audience. A solid marketing strategy for small business can really help with that.
One major pain point is data normalization. Facebook's definition of "engagement" is different from TikTok's. How do you compare those two? Smart marketers find ways to normalize this data, creating consistent metrics across platforms. For example, consider calculating a weighted engagement score based on how important each platform is to your specific audience.
Then there's the ever-present issue of attribution. Each platform has its own default attribution window (the timeframe after someone interacts with your ad that a conversion is credited to that interaction). This can lead to double-counting, artificially inflating your results. A good solution? Choose a single attribution model across all platforms, or consider a tool like viral.app to consolidate and deduplicate your data. It’s essential for accurate reporting.
The sheer number of social media users contributes to this reporting complexity. By 2025, we're looking at an estimated 5.42 billion social media users worldwide, with each person using almost seven different platforms monthly. This research provides more insights into this trend, highlighting why robust social media campaign reporting is more critical than ever.
To help you wrangle these multi-platform metrics, I've put together a handy comparison table:
Platform-Specific Reporting Metrics Comparison
A comprehensive comparison of key metrics available across major social media platforms and how to normalize them for unified reporting
| Platform | Primary Engagement Metric | Conversion Tracking | Attribution Window | Unique Features |
|---|---|---|---|---|
| Reach, Reactions, Shares, Comments | Facebook Pixel | 28-day click, 1-day view (default) | Detailed demographic data | |
| Likes, Comments, Saves, Shares | Facebook Pixel | 28-day click, 1-day view (default) | Strong focus on visual content | |
| TikTok | Views, Likes, Comments, Shares | TikTok Pixel | 7-day click, 1-day view (default) | Emphasis on short-form video and trending sounds |
| Retweets, Likes, Replies | Twitter Tag | 28-day click, 1-day view (default) | Real-time conversations and hashtag tracking |
This table illustrates the key differences in how each platform tracks engagement and conversions. Notice the variations in attribution windows – this is where that double-counting can sneak in. By understanding these differences, you can start normalizing your data for more accurate cross-platform comparisons. Remember, the goal is to create a consistent view of performance, even if the underlying metrics are different.

Video dominates social media. But let’s be honest, a lot of us are analyzing its performance the wrong way. I've seen brands celebrate millions of views, only to realize later those views weren't driving any real business outcomes. Vanity metrics like view counts can be deceptive. We need to go deeper.
I once worked with a brand that had a video go viral – millions of views! Everyone was high-fiving…until we noticed the average view duration was a mere few seconds. People were clicking, not watching. The problem? A weak opening hook. By looking at completion rates and drop-off points, they figured out exactly where viewers were bailing and fixed it in future videos. The result? Actual engagement and, more importantly, conversions. Speaking of which, you might find this interesting: repurposing your existing video content.
Another important metric is sound-on viewing percentage. This small detail speaks volumes. In my experience, sound-on viewers are usually more engaged, and more likely to buy. Think about it: if someone chooses to listen, they’re invested. This is especially crucial on platforms like TikTok and Instagram Reels, where sound is key. Using a central ad dashboard can really help manage reporting across different platforms.
One size doesn't fit all when it comes to video analytics. A short Instagram Story needs different metrics than a longer YouTube explainer. For Stories, you might look at tap-forward rate to see how many people skip your content. With longer videos, audience retention and engagement at specific timestamps are more important. This targeted approach gives stakeholders a clearer understanding of performance. This is important because video is huge for consumer behavior. 78% of people prefer learning about products through short videos, and 93% of marketers plan to up their social marketing game in 2025. Check out more social media stats.
Let's be honest, data without action is just noise. I've seen it countless times: beautifully crafted reports packed with impressive metrics, but nothing changes. It's like having a treasure map and never bothering to dig for the gold. What's the point? Your social media campaign reporting needs to actually do something.
This isn't about just throwing numbers on a slide. It's about transforming that data into a compelling narrative that actually influences decisions. It's about understanding your audience, crafting a clear message, and presenting it in a way that resonates. Think of your report like a story. It needs a beginning, a middle, and an end – the context, your findings, and clear recommendations.
Choosing the right visuals can make or break your report. A pie chart is great for showing budget allocation, but it won't tell you how engagement has trended over time – that’s where a line graph shines. For instance, if you’re showcasing a 30% increase in conversions, a bar chart with a clear annotation highlighting that growth will pack a much bigger punch. Don't just present the data; think about the story you want to tell.
One size doesn't fit all when it comes to reporting. A C-suite executive cares about the big picture: How is social media impacting the bottom line? Show them the ROI. A campaign manager, on the other hand, needs the granular details to optimize their day-to-day tactics. Give them the data they need to tweak their strategies. Think about who you’re presenting to and what information will be most useful to them. You might also find this article on the ROI of influencer marketing helpful.
A consistent reporting framework keeps you organized and ensures you're hitting all the key points. I personally like to use this simple structure:
This framework provides a logical flow, making it easier for stakeholders to understand the information and, most importantly, take action. It transforms your report from a static document into a dynamic tool for improvement. Remember, the goal of social media campaign reporting isn't just to show what happened, but to shape what happens next.
To further illustrate how to tailor your reports, let's look at a breakdown of essential reporting elements by audience. The following table outlines which metrics to emphasize, the ideal report format, and the recommended reporting frequency for different stakeholders.
| Audience | Key Metrics | Report Format | Frequency | Focus Areas |
|---|---|---|---|---|
| C-Suite Executives | ROI, Overall Reach, Brand Awareness, Conversions | Presentation | Monthly | High-level impact on business objectives |
| Campaign Managers | Engagement Rate, Click-Through Rate, Conversion Rate | Dashboard | Weekly | Campaign performance and optimization opportunities |
| Content Creators | Reach, Impressions, Engagement, Audience Growth | Spreadsheet | Weekly | Content performance and audience engagement |
| Client stakeholders | ROI, Key Performance indicator, progress towards achieving objective | Dashboard/presentation | Weekly/Monthly | Overall performance and return |
This table emphasizes that effective reporting requires understanding your audience’s needs. While executives focus on the big-picture impact, campaign managers and content creators need more granular data to optimize their work. By tailoring your reports to each audience, you ensure the data is relevant, actionable, and ultimately drives positive change.
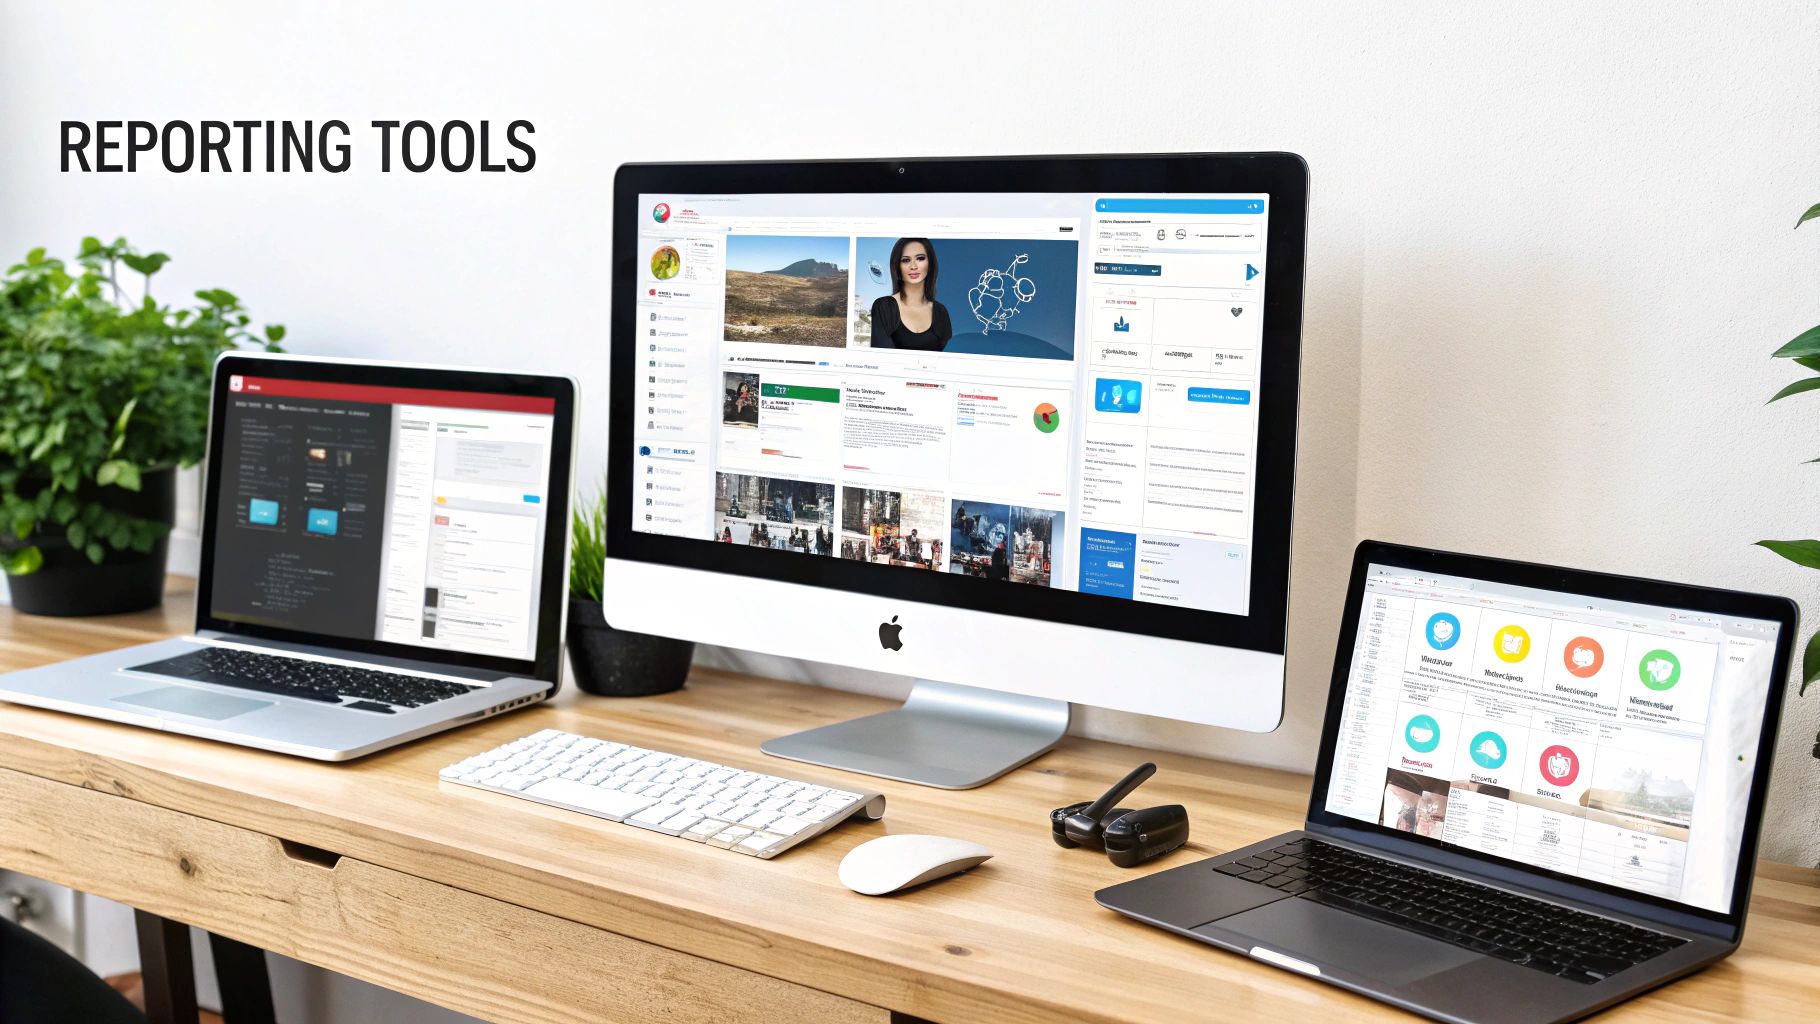
This is where the real magic happens: turning raw social media data into actual, workable strategies. The best marketers I know don't just report on what's already happened. They use that data to shape the future of their campaigns, constantly tweaking and improving along the way.
Let's talk about uncovering those hidden gems in your data. Sometimes, the most valuable insights aren't the obvious ones. They're the subtle clues that tell you what your audience really wants, where your content might be missing the mark, or even how you could be spending your budget more wisely. I've seen entire campaigns do a 180 because someone noticed a tiny detail in the data that everyone else overlooked. Think of it like this: a slight dip in engagement on certain types of posts could point to audience fatigue, signaling it's time to switch up your content strategy.
One powerful technique I use all the time is cohort analysis. This basically means grouping your audience based on shared characteristics (like when they started following you or their first purchase) and then tracking how they behave over time. This can really help you understand how different segments of your audience interact with your campaigns and find areas to improve. For example, if a particular cohort has a way lower conversion rate, you might need to tweak your messaging or targeting just for them.
Predictive insights are another game-changer. By analyzing past data, you can actually anticipate future performance trends and address potential issues before they become real problems. Imagine knowing which campaigns are likely to stall next month so you can proactively adjust your strategy. That’s the power of predictive analytics. Tools like viral.app can be really helpful here, providing detailed campaign data and AI-powered predictions.
So, how do successful marketers actually use these reporting insights? They're constantly refining their targeting strategies, making sure their messages reach the right people at the right time. They're also adjusting their creative approaches based on what resonates best with their audience. And, they're always optimizing their budget distribution to get the most bang for their buck. I once saw a simple budget reallocation based on data insights lead to a 25% increase in conversions for a single campaign. It was amazing!
For example, if your reports show that video content performs way better than static images, you might want to shift more of your budget towards video production. Or, if a particular demographic is super engaged but not converting, you could tailor your ad copy and targeting to speak directly to their needs. Every data-informed adjustment brings you closer to your campaign goals. Remember, social media campaign reporting isn't just about tracking what happened – it’s about using that information to create the results you want.
Let's be honest, reporting can sometimes feel like a chore. But trust me, when it's done right, it's a game-changer for your social media campaigns. It's not about scrapping everything and starting from scratch, it's about building on what you've already got. Think of it like leveling up your reporting game, one step at a time. This reminds me a bit of how crucial data-driven marketing is overall, as highlighted in this article about data-driven marketing strategies.
Imagine renovating a house. You wouldn't demolish everything at once, right? You'd focus on the most important changes first. The same applies to reporting. Begin with the fundamentals:
These basic improvements will have a big impact right away, giving you a solid foundation to build on.
Once you have the basics down, you can add some more advanced techniques:
Don't try to do everything at once. Start with the basics, then gradually add these more advanced techniques over time. Maybe tackle the basics in the first few months, then layer in the advanced stuff over the next two quarters. It's all about building sustainably.
Your team is essential to making this work. Invest in training and create clear documentation for any new tools. When your team understands the “why” and the “how,” they’ll be much more likely to embrace the new processes. And don’t forget to celebrate successes along the way! Recognizing progress helps build momentum and keeps everyone motivated.
By following this roadmap, you'll turn reporting from a dreaded chore into a valuable tool. You’ll have the insights you need to make smart decisions, optimize campaigns, and really demonstrate the value of your social media efforts.
Ready to unlock the potential of your social media data? Sign up for viral.app and see the difference a data-driven approach can make.
We're here to help you get the most out of viral.app.
Become an expert in UGC marketing today leveraging our industry knowledge and unique tools.
Keep your own content analytics clean while still tracking what competitors are doing
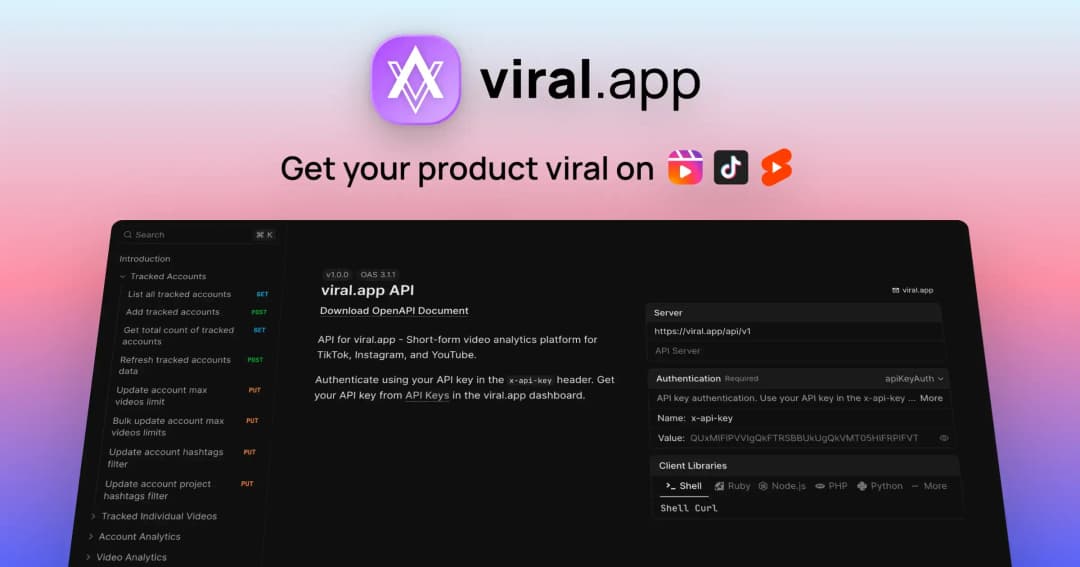
Build custom workflows and integrations with programmatic access to your analytics
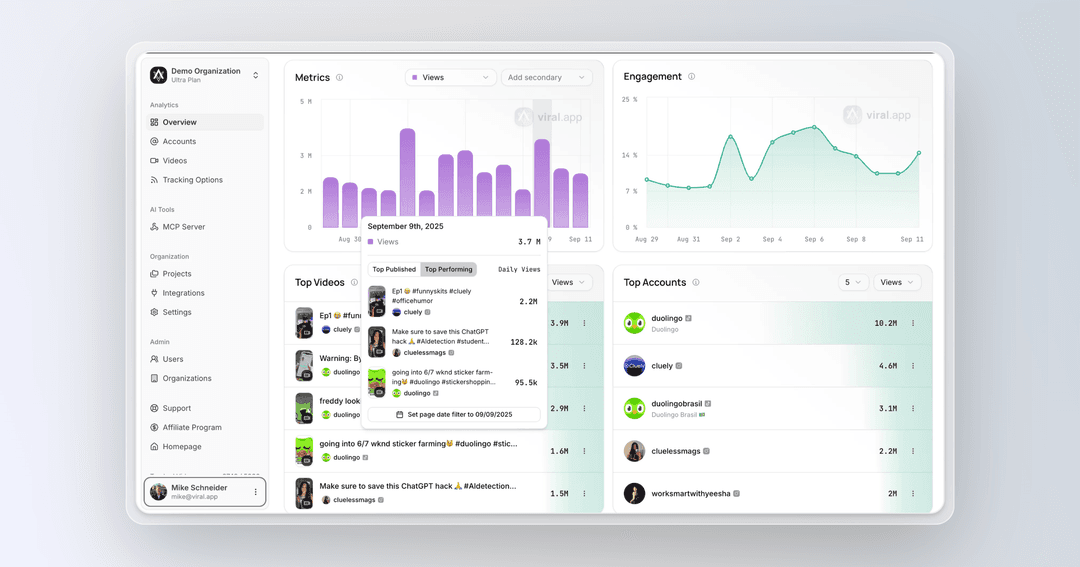
Track how single videos go viral with detailed performance insights and daily top performer breakdowns

UGC-Marketing with the ultimate growth-pilot.