Social Media Campaign Report Template for Creator and UGC Campaigns
What to put in a creator campaign report, when to send it, and a template you can copy, with CPM benchmarks from creator campaigns paid through viral.app and timing data from about 240,000 tracked videos.
Written by
PublishedJune 15th, 2025
UpdatedOctober 1st, 2026
A creator campaign report answers four questions on one page: what the campaign cost, how many views it got, what it drove, and what to change next. Lead with a KPI table (views, posted videos, active creators, engagement rate, spend, CPM, conversions), then name the top creators and top videos, then write down the learnings. A copyable template follows the section list below.
Our data changes three things about the report:
Benchmark CPM on creator pay. Across creator campaigns paid through viral.app, the median paid $1.64 in creator pay per 1,000 counted views.
Name the top creators. In the median campaign with 10 or more paid creators, the top 10% of creators produced 55% of the views.
Don't close it too early. A TikTok report closed 7 days after posting shows only 60% of the views those videos have at day 30.
Median creator-pay CPM
$1.64
Creator pay per 1,000 counted views across viral.app campaigns. Half fell between $0.85 and $3.59.
Views from the top 10% of creators
55%
Median campaign with 10 or more paid creators.
Views a 7-day TikTok report captures
60%
Share of 30-day views, about 140,000 TikToks. For Reels it is 75%.
What should a social media campaign report include?
Eight sections, in this order. The first three fit on one screen and make the short version for leadership.
A generic social media report covers your own accounts. A creator campaign report is different in three ways: the videos sit on other people's accounts, cost is set per creator, and a handful of videos bring most of the views. Sections 4 to 6 exist because of that.
Copy this social media report template
Paste this into a doc and fill in the brackets. Sections 1 to 3 are the one-page version for leadership; the rest is the working report for the team running the campaign. Each KPI is defined in the KPI table section below. If your team works in Notion, the free campaign report Notion template adds linked databases for posts and costs that work out cost per 1,000 views.
# [Campaign name] report: [period, e.g. Sep 1 to Sep 30, 2026]

- Data as of: [date, time, timezone]
- Prepared by: [name]

## 1. Summary

- Goal: [e.g. 2M organic views and 400 trials at under $2 creator-pay CPM]
- Result: [views] views and [conversions] [trials/installs/sales] at $[x] all-in CPM
- Biggest learning: [one sentence]
- Recommendation: [one change for next period]

## 2. Setup

- Dates: [start] to [end]
- Platforms: [TikTok, Instagram, YouTube]
- Creators assigned: [n]
- Videos agreed: [n per creator per week]
- Pay model: [$x per video + $y per 1,000 views, bonus at z views]
- Budget: $[x], spent: $[y]

## 3. KPIs

| KPI                          | This period | Target | Last period | Change |
| ---------------------------- | ----------- | ------ | ----------- | ------ |
| Views, total                 |             |        |             |        |
| Views, organic               |             |        |             |        |
| Views, paid (boosted posts)  |             |        |             |        |
| Posted videos                |             |        |             |        |
| Active creators              |             |        |             |        |
| Engagement rate              |             |        |             |        |
| Spend                        |             |        |             |        |
| Creator-pay CPM              |             |        |             |        |
| All-in CPM                   |             |        |             |        |
| Cost per video               |             |        |             |        |
| Breakout videos (10x median) |             |        |             |        |
| Conversions                  |             |        |             |        |
| Cost per conversion          |             |        |             |        |

## 4. Creators

| Creator | Videos | Views | Share of views | Creator pay | Creator-pay CPM | Renew? |
| ------- | ------ | ----- | -------------- | ----------- | --------------- | ------ |
| [name]  |        |       |                |             |                 |        |

- Assigned but no video this period: [names] ([videos agreed] agreed)

## 5. Top videos

| Link  | Creator | Platform | Views | Engagement rate | x creator median | Hook / format |
| ----- | ------- | -------- | ----- | --------------- | ---------------- | ------------- |
| [url] |         |          |       |                 |                  |               |

## 6. Paid vs organic

- Boosted posts: [n]
- Ad spend: $[x], paid views: [x]
- Organic creator-pay CPM (creator pay ÷ organic views × 1,000): $[x]

## 7. Conversions

- Sources used: [app analytics / shop / UTM links / promo codes / signup survey]
- [Chart: daily views next to daily installs, trials or sales]

## 8. Learnings and next steps

- Repeat: [hooks, formats, creators]
- Stop: [what did not work]
- Budget: [move money from X to Y]
- Test next: [one or two experiments]
Variant for your own accounts
If you report on your brand's own profiles instead of creators' videos, keep sections 1, 3 and 8 and swap the creator sections for audience numbers from each platform's native analytics:
## KPIs per platform: [TikTok / Instagram / YouTube / LinkedIn]

| KPI                       | This period | Last period | Change |
| ------------------------- | ----------- | ----------- | ------ |
| Followers (end of period) |             |             |        |
| Follower growth           |             |             |        |
| Posts published           |             |             |        |
| Reach (unique accounts)   |             |             |        |
| Views or impressions      |             |             |        |
| Engagement rate           |             |             |        |
| Link clicks               |             |             |        |
| Conversions               |             |             |        |

## Top 5 posts

| Link | Format | Views | Engagement rate | What worked |
| ---- | ------ | ----- | --------------- | ----------- |
The KPI table: what to report and how to calculate it
Report these KPIs for the period, with target and last period next to each. Keep the definitions fixed from report to report, or the trend line means nothing.
For what a "good" view count or breakout looks like per platform and follower size, use the benchmarks in how many views is viral. For likes, comments, shares and saves in more depth, see our guide to social media engagement metrics.
A view is not the same thing on every platform
You can add views across platforms for the headline total, but keep the per-platform split in the table, because each platform counts differently and the rules change:
Instagram: Meta introduced a views metric in Graph API v22.0 (January 21, 2025) and retired plays and impressions for all API versions on April 21, 2025. Reports from before and after that date don't compare.
What public data can't show
Public tracking gives you views, likes, comments and shares for every creator's video. Watch time, retention, reach, audience demographics and link clicks are visible only to the account owner, so ask creators for screenshots of their own analytics on the top videos if you need them. Instagram Stories can't be tracked at all: their views are shown only to the account owner and the story disappears after 24 hours.
How often should you report a creator campaign?
Send a short update every week or every payout period while the campaign runs, and the full report about 30 days after the period's last video went live. A report closed earlier undercounts, because campaign totals keep growing long after the typical video has stopped.
A TikTok campaign closed after 7 days shows 60% of its 30-day views
Share of the combined 30-day views of all videos, reached 1, 3, 7 and 14 days after posting
A TikTok campaign closed after 7 days shows 60% of its 30-day views
TikTok videos
Instagram Reels
Day 1
17.9%
41.2%
Day 3
40.0%
60.1%
Day 7
59.7%
74.6%
Day 14
78.3%
87.0%
Most videos stop growing within a day; the campaign total keeps climbing. The median TikTok had 86% of its 30-day views after 24 hours and 97.5% after a week. The total lags because the few videos that break out keep growing for weeks.
Views keep coming after day 30. TikToks posted April 1 to June 15, 2026 gained another 21% of views between day 30 and day 60, and Reels another 12% (about 130,000 TikToks and 98,000 Reels). Put an "as of" date on every report, and don't compare a fresh period with a closed one.
Match the update to the payout cycle. Of the campaigns with a completed payout in viral.app between December 2025 and September 2026, 69% pay creators monthly, 24% weekly and 7% every two weeks. Reporting per payout period keeps spend and views in the same window.
What CPM should a creator campaign report show?
Report two blended CPMs for the campaign: creator-pay CPM (creator pay ÷ views × 1,000) and all-in CPM (all spend, including product, boosts and fees, ÷ views × 1,000). Our benchmarks are creator-pay CPMs. Here is where campaigns paid through viral.app landed.
29% of the campaigns had a creator-pay CPM under $1. Our sub-$1 CPM UGC playbook covers how apps get there with many small creators and performance pay.
Don't average creator CPMs. The median single creator payout worked out to $3.63 per 1,000 views, while the same payouts added together came to $1.09. Creators paid a flat fee for a video that stalls have high CPMs; the few videos that break out pull the campaign's cost per view down. An average of creator CPMs describes a typical creator, not what the campaign paid per view.
Split paid from organic views
On a few hundred TikToks boosted as Spark Ads with viral.app's integration connected, 54% of all views were paid. If paid views stay in the total, the creator-pay CPM looks better than it was, and creators paid per 1,000 views get paid for views your ad budget bought. Report organic views, paid views and ad spend on separate lines.
Report top creators and top videos, not averages
A small group of creators and videos brings most of the views, so the report should name them.
What that means for the report:
List the top 5 creators with videos, views, creator pay and creator-pay CPM. Show the video count next to views, so readers can tell volume from performance.
List creators with no video in the period, next to the number of videos they agreed to.
Look at the bottom half too. In the median campaign the bottom half of creators produced 8% of views, so make renewal calls in the report.
Rank the top 10 videos by how far they beat their creator's median. A video with 10x the creator's usual views is a breakout and tells you which hook or format to brief next.
Show the median video next to the total. With this much skew, average views per video sits far above what a typical video does.
How do you measure conversions from organic creator videos?
Most organic creator videos have no clickable link, so no single source counts every conversion. Use two or three signals, and say in the report which ones you used.
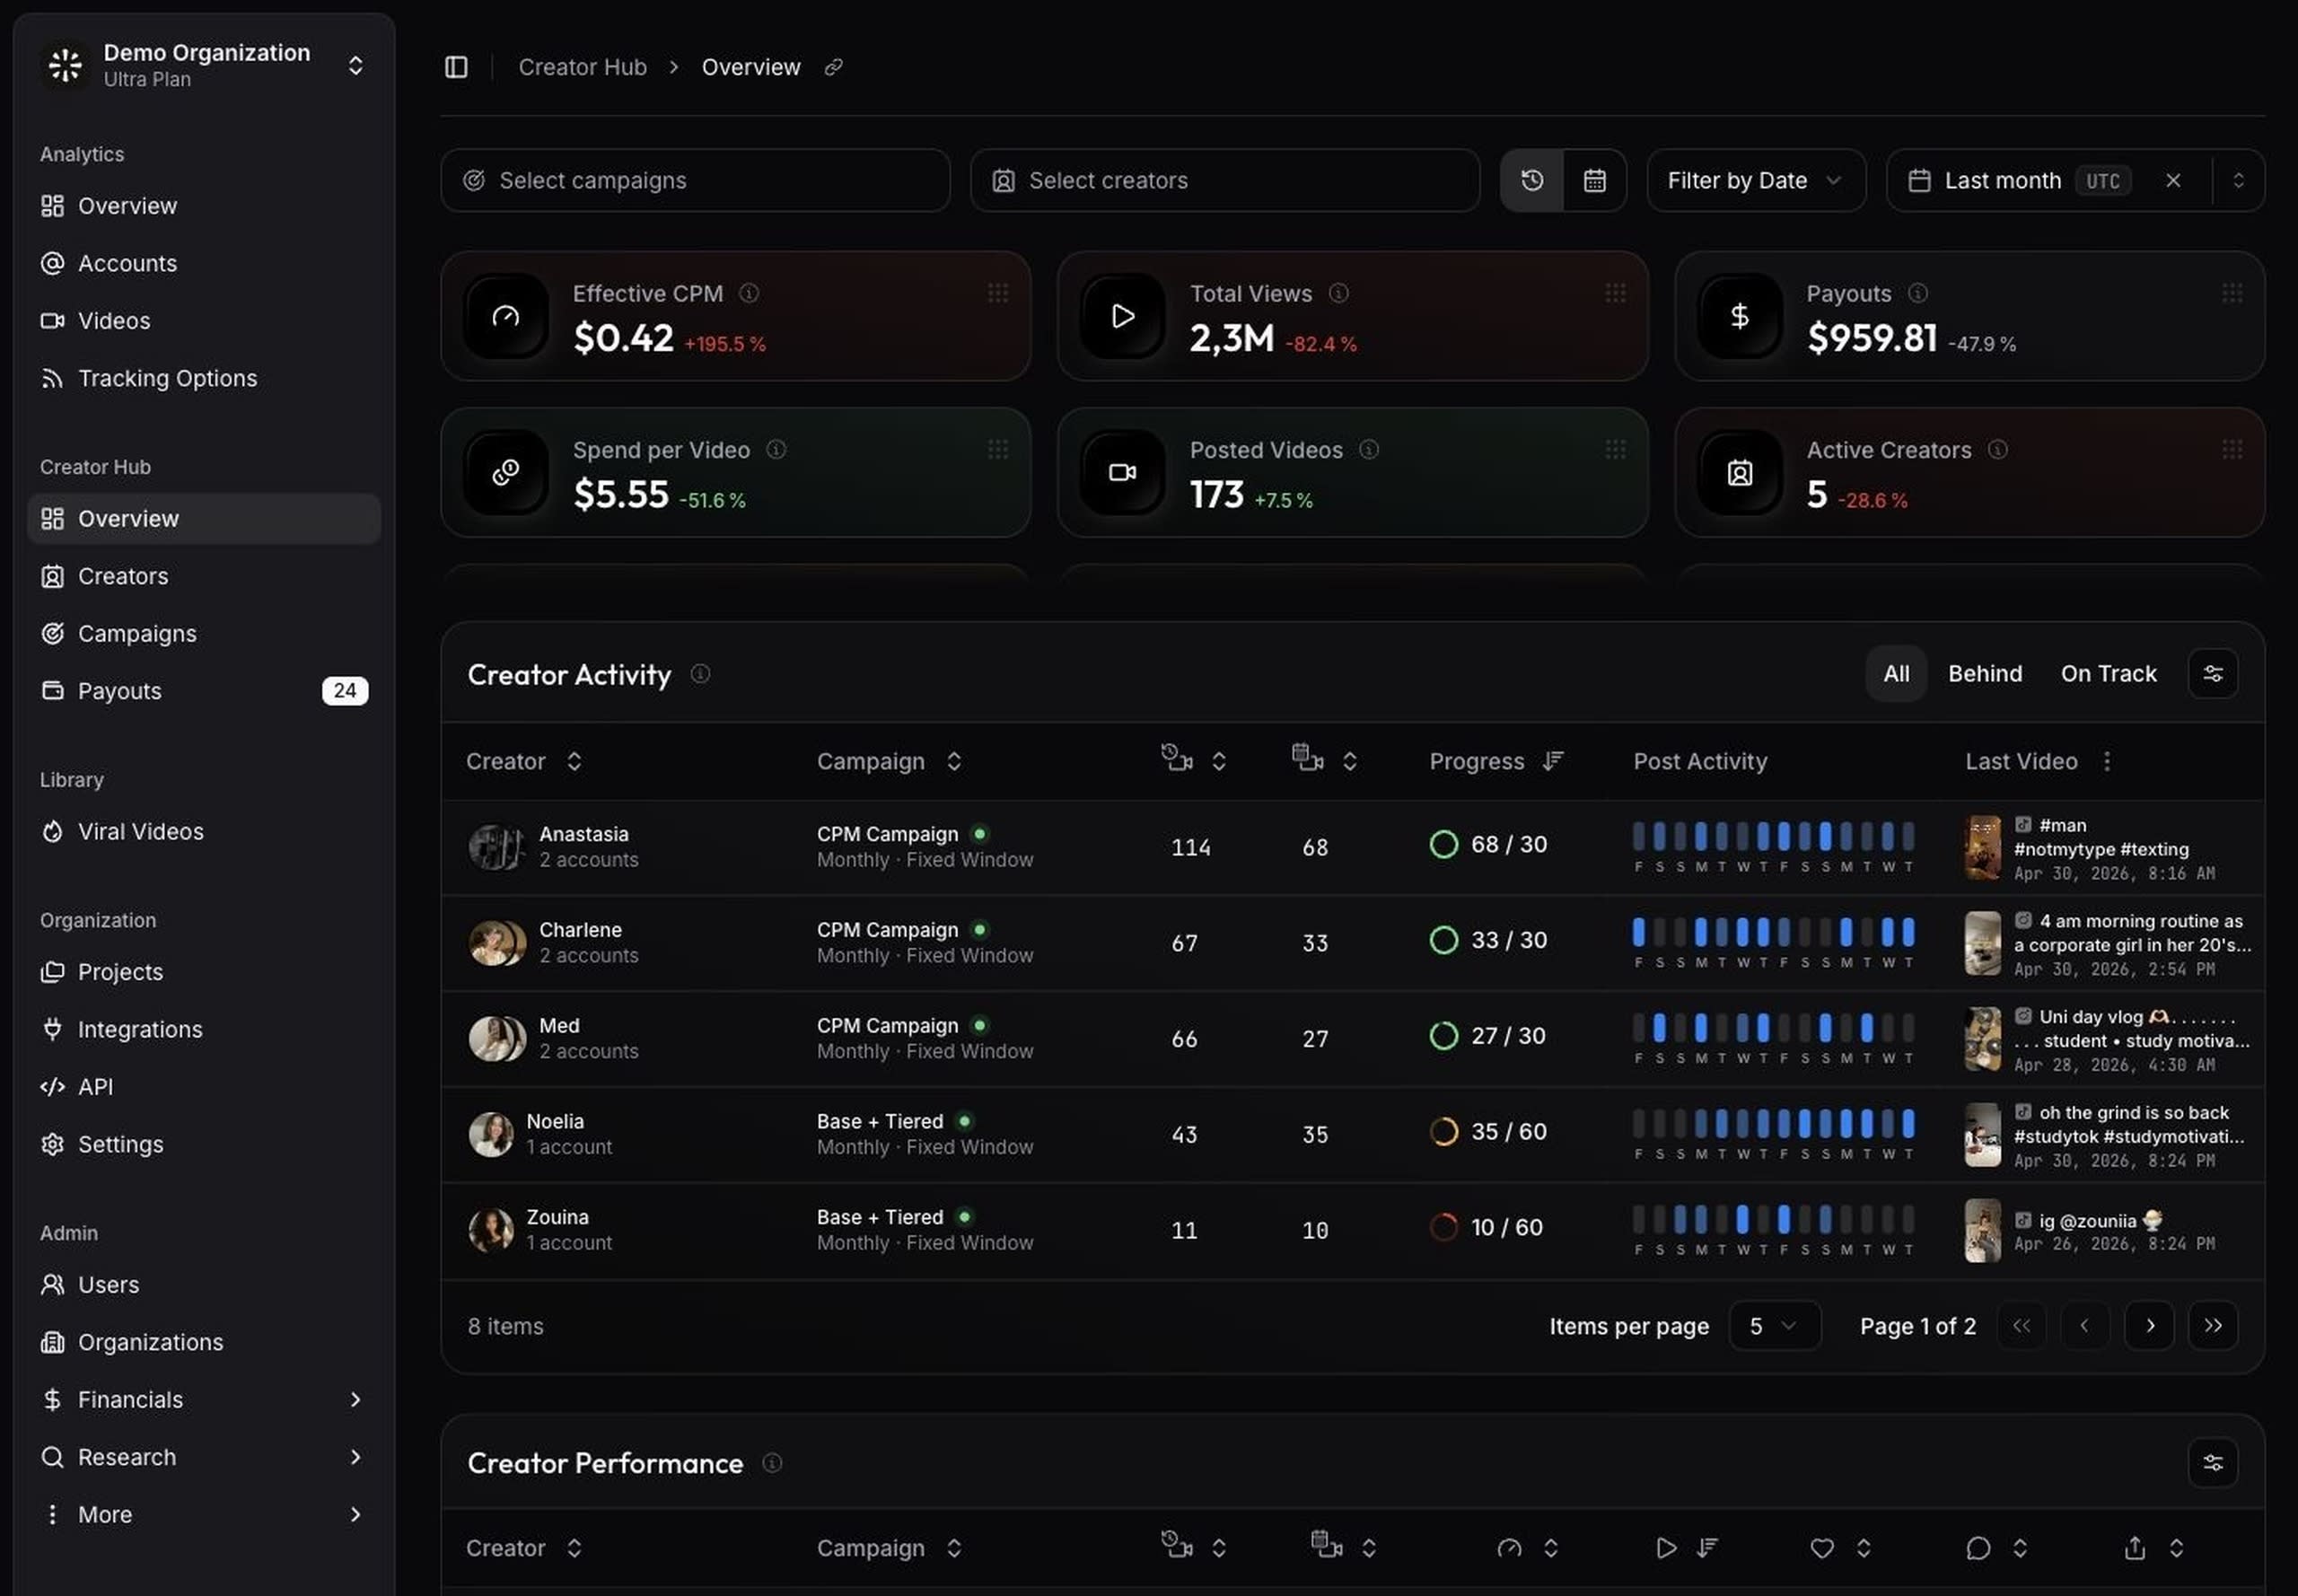
KPI table: the Creator Hub Overview shows Campaign Views, Posted Videos, Active Creators and Effective CPM, filtered by campaign, creator and date range. Effective CPM is a creator-pay CPM: payouts ÷ campaign views × 1,000, shown as N/A below 1,000 views. Campaign Views are the views a creator's videos gain while the creator is assigned to the campaign, counting only videos posted during the assignment.
Creators: the Creator Activity table shows each creator's posted videos against the campaign's video target and filters to creators who are behind.
All tracked content: the Analytics Overview shows views, likes, comments, shares, bookmarks, engagement and posted videos across every tracked account. Tags narrow it to one campaign, market, product line or hook, and tag rules apply tags automatically from platform, hashtags, captions, views or engagement rate. Projects group accounts by product.
Top videos: the videos table has a Virality column, a video's views divided by the median views of its account. That is the "x creator median" column of the template.
Payouts: campaigns calculate each creator's payout per billing period from base pay, CPM rates and view bonuses, and every paid payout has a per-video breakdown.
Paid vs organic: with TikTok or Meta connected, analytics show organic and paid views separately and view-based payouts count organic views only. Analytics › Ads shows spend, CPM, results and cost per result for every ad on a tracked post, with a daily chart per ad.
Conversions: connect RevenueCat and the Analytics Overview shows app revenue, new customers, trials and paid subscriptions next to views.
Exports to CSV:
every table, with your filters applied
the Overview's day-by-day view, like, comment and share gains
Open Creator Hub Overview, filter to the campaign and period, and copy Campaign Views, Posted Videos, Active Creators and Effective CPM (your creator-pay CPM).
2
Fill the creators and top videos sections
Sort the videos table by views and note each top video's Virality. Filter Creator Activity to creators who are behind to find anyone without a video this period.
3
Add paid views and conversions
Copy organic and paid views from the paid and organic split, ad spend from Analytics › Ads, and app outcomes from the RevenueCat cards or your own shop data.
4
Export the appendix
Export the filtered videos table, the daily gains, and each payout's per-video breakdown as CSV for anyone who wants the raw numbers.
One timing note: viral.app refreshes videos under 60 days old at every scheduled sync slot, videos 60 to 119 days old every 2 days, and older videos every 7 days. On plans with 6 or more sync slots a day, videos under 7 days old refresh at every slot and videos 7 to 59 days old twice a day. For daily reporting, schedule a refresh late in the day, such as 21:00 to 23:00 UTC, and pull end-of-period numbers after it.
Frequently asked questions
A document that shows what a campaign cost, how many views and engagements it got, what it drove in installs or sales, and what to change next. For creator campaigns it also lists results per creator and the top videos.
Start with a short summary of goal and result, add the setup, then a KPI table with target and last period for each metric. Follow with top creators, top videos, paid versus organic views, conversions and learnings. Write the summary last.
For a creator campaign: views, posted videos, active creators, engagement rate, spend, creator-pay CPM, all-in CPM, cost per video, breakout videos and conversions where you can measure them. Report views per platform, because platforms count them differently.
A short update weekly or per payout period while the campaign runs, a full report about 30 days after the last video of the period, and a quarterly review. A TikTok report closed after 7 days shows only about 60% of the 30-day views.
Across campaigns paid through viral.app, the median creator-pay CPM was $1.64 per 1,000 counted views, and half fell between $0.85 and $3.59. 29% came in under $1. Product, ad and agency costs come on top.
Report them on a separate line. On a few hundred boosted TikToks, 54% of views were paid. Mixing them into organic views makes the creator-pay CPM look better than it was.
The summary, setup and KPI table should fit on one screen, because that is what most readers see. Put the creator list, top videos, conversions and exports below it for the team running the campaign.
How we measured
Creator-pay CPM and creator concentration: completed campaign payouts in viral.app with billing periods from December 12, 2025 to September 30, 2026 that counted views. Creator-pay CPM is the payout amount in USD divided by the views the payout counted under its campaign's rules, times 1,000. Product, agency, ad and platform costs are not included. The CPM percentiles use the campaigns with at least 100,000 counted views. The creator shares use the campaigns with at least 10 paid creators; leaving out the workspace with the most campaigns changes the top-10% share by less than two percentage points.
Payout cycles: all campaigns with at least one completed payout in the same December 2025 to September 2026 window, including some whose payouts recorded no counted views and so are not in the CPM figures.
View timing: videos posted May 1 to July 15, 2026 with snapshots 18 to 30 hours, 66 to 78 hours, 6.5 to 7.5 days, 13.5 to 14.5 days and 28 to 32 days after posting. Shares are the sum of all videos' views at each point divided by the sum at day 30. No single video holds more than 2.3% of the day-30 total. The day 30 to day 60 growth uses videos posted April 1 to June 15, 2026 with snapshots at 28 to 32 and 58 to 62 days.
Account concentration: about 18,000 TikTok and 13,000 Instagram accounts with at least 20 videos posted October 1, 2025 to August 31, 2026; the median account had 54 TikToks or 55 Reels.
Paid views: a few hundred TikToks boosted as Spark Ads with the integration connected, paid views as reported by TikTok against each video's total views as of October 2026.
Who the accounts are: brands, agencies and creators choose the accounts they track in viral.app: their own, their creators' and competitors'. All figures are aggregates; no single customer, campaign or account is shown.
Build your next report from live data
The KPI rows, creator list and top videos in this template all come from tracking every creator's videos in one place. Create a viral.app account to track your creators across TikTok, Instagram, YouTube, Facebook and Snapchat and report your next campaign from live numbers.