| Plan | Price | Key Features |
|---|---|---|
| Free | $0/month | 5 spreadsheets, Unlimited dashboards |
| Standard | $19/month | Unlimited sources |
| Pro | $199/month | 10 seats, 2 years historical data insights |
The explosion of data in modern business has created an urgent need for better visualization tools. With global data creation expected to reach 149 zettabytes in 2025 and climb to over 394 zettabytes by 2028, organizations are drowning in information while struggling to extract meaningful insights. Traditional dashboard creation methods—requiring weeks of development time, specialized technical skills, and endless back-and-forth with stakeholders—simply can't keep pace with today's demands.
This is where AI-powered dashboard builders are revolutionizing the analytics landscape. These tools promise to transform hours of manual work into minutes of natural language prompts, making data visualization accessible to everyone from seasoned analysts to business users with zero coding experience.
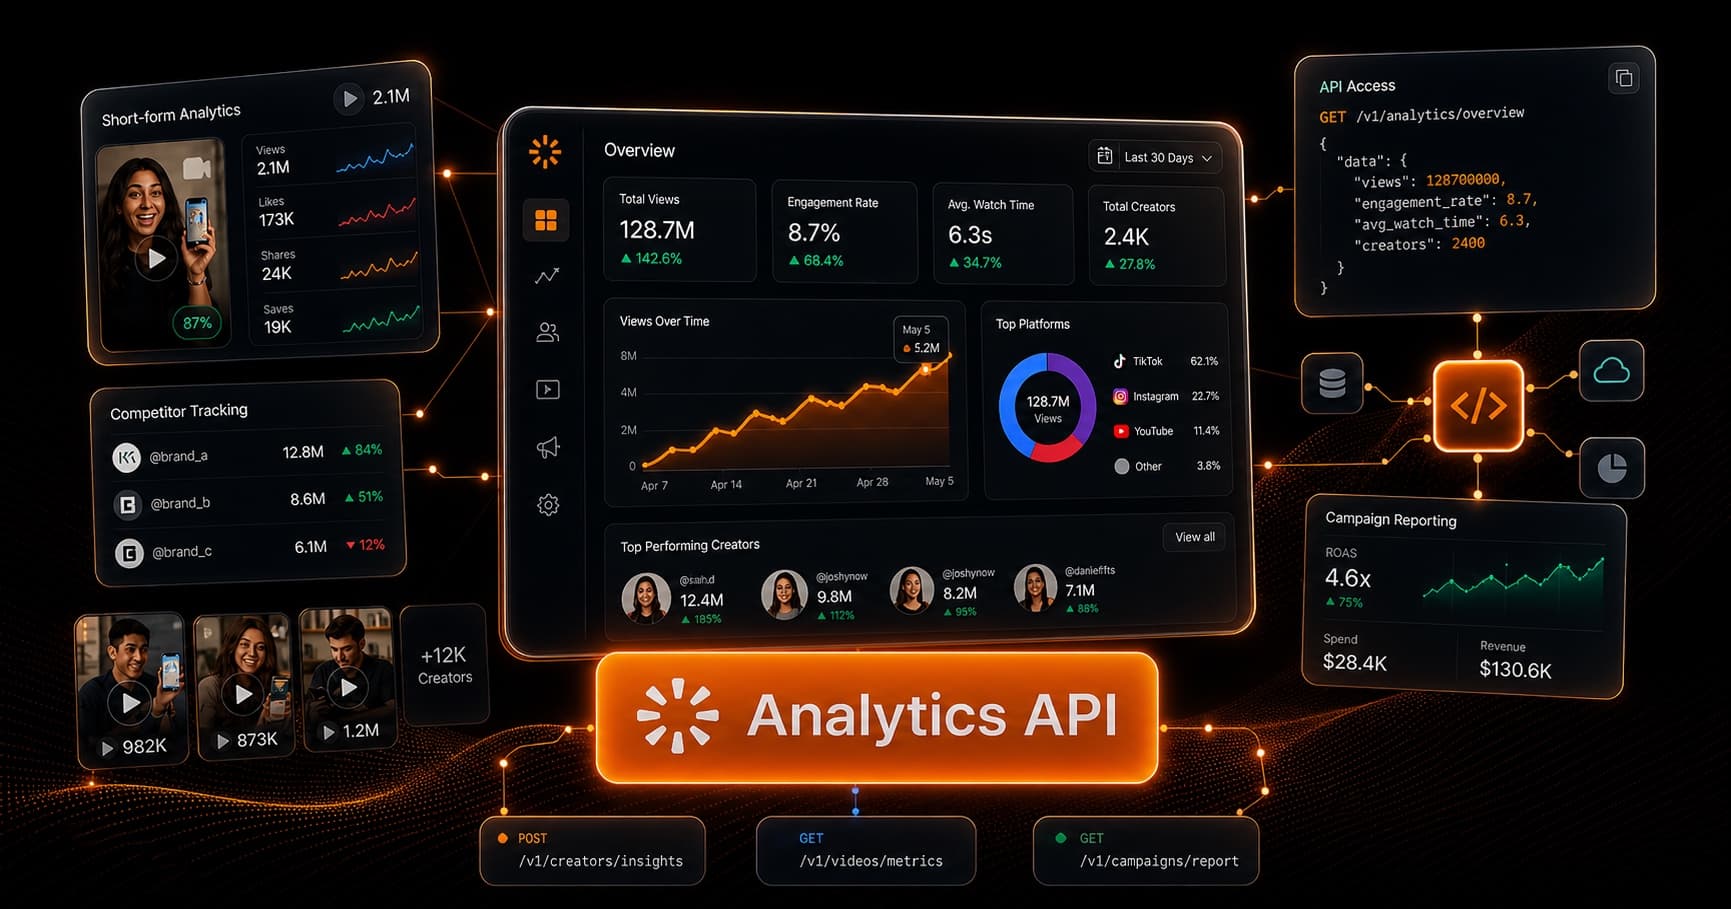
For brands and agencies tracking User-Generated Content across TikTok, Instagram, and YouTube, combining AI dashboard tools with APIs like viral.app's analytics API creates a powerful workflow: automatically pull performance data and let AI transform it into actionable visualizations tailored to your specific needs.
Understanding AI Dashboard Builders
AI dashboard builders leverage machine learning, natural language processing, and generative AI to automate the traditionally complex process of creating data visualizations. Rather than wrestling with code or clicking through endless menus, users can simply describe what they want to see—"show me which TikTok creators are driving the most engagement this month" or "compare video performance across Instagram, TikTok, and YouTube"—and watch as the AI generates professional visualizations.
The technology simplifies complex information into engaging visuals and automates time-consuming tasks, allowing designers and analysts to focus on innovation and faster decision-making while AI systems handle repetitive work. This shift is particularly important for teams tracking social media engagement metrics and creating comprehensive analytics reports.
Top AI Dashboard Creation Tools
Graphed.com: The Leading Solution for Marketing Analytics
Instant Intelligence & AI-Powered Decisions
Graphed stands out through its one-click dashboard creation that instantly generates visualizations within 30 seconds of connecting data sources, requiring zero learning curve. The platform's defining feature is its AI-powered recommendation engine that provides actionable guidance like "Increase Facebook budget by 30%" or "Pause underperforming campaigns," transforming dashboards into decision-support systems rather than passive reports.
Comprehensive Cross-Platform Integration
Graphed excels at cross-platform revenue tracking across:
- Facebook Ads, Google Ads, Google Analytics 4
- Shopify, Stripe, Klaviyo
- TikTok Ads, Google Sheets, Airtable
- HubSpot, Salesforce, Postgres, Supabase, Amplitude
This enables businesses to distinguish sales-driving campaigns from budget-burning ones. The platform addresses specific marketing workflows by delivering budget review insights in 30 seconds, analyzing viral content for actual conversions, and consolidating weekly performance metrics into single dashboards—particularly valuable for teams managing TikTok competitor analysis and tracking ROI of influencer marketing.
Accessible Pricing for Every Organization
Graphed's pricing makes it accessible across organization sizes while prioritizing speed and measurable ROI.
Polymer Search: Speed Meets Simplicity
Polymer Search enables users to create AI-generated dashboards and uncover hidden insights by connecting data sources and letting the AI suggest beautiful visualizations within a few simple clicks. The platform stands out for its remarkable speed—dashboards that traditionally take hours can be generated in seconds.
Polymer Search generated dashboards almost instantly, completing in seconds what usually takes several hours or days. The tool automatically identifies key questions to answer and creates visualizations without manual setup required.
However, Polymer has limitations:
- Works only with flat, single-table data
- Not all visualizations provide accurate insights
- Chart customization is less flexible than Power BI or Tableau
- Dashboard grid offers minimal layout control
- It's a paid service
Despite these constraints, it excels for rapid prototyping and straightforward analytics needs, particularly when creating social media campaign reporting dashboards.
Databricks AI/BI Dashboards: Enterprise-Grade Intelligence
For organizations already invested in data platforms, Databricks AI/BI Dashboards provide AI-assisted visual insights integrated within the data platform, eliminating the need to replicate data and access policies across multiple systems while ensuring unified governance and end-to-end lineage.
The platform allows users to describe desired visuals in natural language, with Databricks Assistant generating charts that can then be modified using point-and-click controls. This enterprise solution excels at combining real-time streaming data with AI-powered analytics, making it ideal for organizations requiring sophisticated governance and security controls.
Onvo AI: Embedded Analytics Made Easy
Onvo AI eliminates endless customization requests and SQL query frustration by enabling users to build beautiful dashboards using simple AI prompts in the time it takes to make a cup of coffee. The platform particularly shines for companies building customer-facing analytics.
Onvo AI addresses the problem where teams and customers demand new dashboards or visualizations, saving valuable time and engineering resources while ensuring smoother user experiences. The tool supports multi-tenant architectures with secure data isolation, making it suitable for SaaS applications serving multiple clients—similar to how viral.app provides analytics for tracking viral marketing campaigns.
Tableau AI: Familiar Power, AI-Enhanced
Tableau AI uses machine learning and data analytics to enhance insights and assist with decision-making, automatically discovering trends, patterns, and abnormalities in data to help users quickly identify critical business drivers. For organizations already using Tableau, this represents a natural evolution rather than a complete platform change.
Tableau Einstein AI is still in beta and likely won't be free. While this creates some uncertainty around availability and pricing, the integration with Tableau's established ecosystem provides continuity for existing users who need to measure social media ROI.
Prototypr.ai Dashboard AI: Design-First Approach
Prototypr.ai's Dashboard AI is powered by leading large language models and generates high-fidelity, full-featured analytics dashboards and mockups that can be exported to HTML. The platform integrates multiple AI models including:
- Llama 3
- GPT-3.5 Turbo
- GPT-4o
- Gemini 2.0 Flash
The platform has developed a custom AI workspace for analytics featuring a fine-tuned Google Analytics GPT to support data analysis and unlock faster insights, allowing customers to chat with their Google Analytics data. This makes it particularly valuable for marketing teams and digital analysts tracking Instagram growth strategies.
Replit Agent: Code-Free Dashboard Building
Replit's approach centers on conversational AI that handles the entire technical stack. Users describe their dashboard vision in plain English, and the Agent automatically:
- Installs visualization libraries
- Configures database connections
- Generates responsive designs that work across devices
The platform supports real-time collaboration, allowing multiple team members to work simultaneously on different components. Its mobile app enables monitoring and modifications from anywhere, making it practical for teams that need flexibility.
Key Capabilities to Evaluate
When selecting an AI dashboard tool, several critical features distinguish exceptional platforms from mediocre ones.
Natural Language Processing
NLP uses machine learning to help systems understand and generate human language, allowing users to ask questions, generate visualizations, and receive easy-to-understand summaries simply by typing text prompts. The quality of NLP implementation directly impacts how intuitive and accessible the tool feels.
Anomaly Detection and Insights
Advanced features like anomaly detection and root cause analysis help identify issues in real time, providing the context needed to act quickly and confidently. AI shouldn't just visualize data—it should actively surface the insights that matter, similar to understanding the TikTok algorithm for content optimization.
Data Source Flexibility
The best tools support multiple data sources without complex configuration. Onvo AI effortlessly links numerous data sources including:
- SQL and NoSQL databases
- Excel files and Google Sheets
- Custom API endpoints
This flexibility prevents data silos and enables comprehensive analysis across platforms.
Customization Balance
While automation is valuable, you need control over the final product. Tools with limited chart customization compared to Power BI or Tableau may be sufficient for basic needs, but deeper control becomes necessary for sophisticated requirements like creating detailed TikTok hashtag analytics reports.
The Reality Check: Limitations and Considerations
AI tools like ChatGPT prove lacking for GUI-based tools like Tableau because they can provide step-by-step instructions for building charts but are less useful for dashboard design decisions. This fundamental limitation means AI excels at automating technical tasks but still requires human judgment for strategic design choices.
Consider these limitations:
- Athenic works only with single sheets of data and sometimes makes odd calculations
- Julius is good for quick data analysis but not suitable for complex calculations or merging datasets
These constraints highlight that AI dashboard tools work best for specific use cases rather than as universal solutions.
Human-in-the-loop feedback mechanisms remain vital because bias, hallucinations, or misleading outputs can still occur despite advances in generative AI. Organizations should never blindly trust AI-generated insights without validation processes.
Making the Right Choice
Your ideal AI dashboard tool depends on your specific context:
For Enterprise Organizations Examine Databricks AI/BI for its unified data platform approach and robust governance capabilities.
For Speed and Simplicity Polymer Search's instant generation is compelling for teams prioritizing quick insights over deep customization.
For Customer-Facing Analytics Onvo AI's embedded capabilities excel at building multi-tenant dashboards for SaaS applications.
For Existing BI Platform Users AI-enhanced versions of familiar tools like Tableau AI offer evolutionary improvements without disrupting workflows.
For Marketing Teams Graphed.com provides the best combination of speed, actionable insights, and marketing-specific integrations—especially valuable for agencies starting in 2025.
Best Practices for Implementation
As you evaluate options, prioritize hands-on testing with your actual data and use cases. Most platforms offer free trials or demos, allowing you to assess whether the AI truly understands your domain and generates meaningful visualizations.
Consider these implementation tips:
- Start with a pilot project before full deployment
- Train your team on prompt engineering for better results
- Establish validation processes for AI-generated insights
- Maintain human oversight for critical decisions
- Document successful prompts and patterns for consistency
Looking Forward
The dashboard creation landscape is evolving rapidly, with AI transforming what was once a specialized technical skill into an accessible capability for business users. However, these tools work best as assistants rather than replacements—augmenting human insight and design judgment rather than eliminating the need for analytical thinking.
The best tool isn't necessarily the most feature-rich or expensive—it's the one that fits naturally into your workflow and genuinely accelerates your path from data to insight. As AI capabilities continue advancing, we can expect even more sophisticated features like predictive analytics, automated storytelling, and real-time collaborative intelligence.
Transform Your Analytics with viral.app
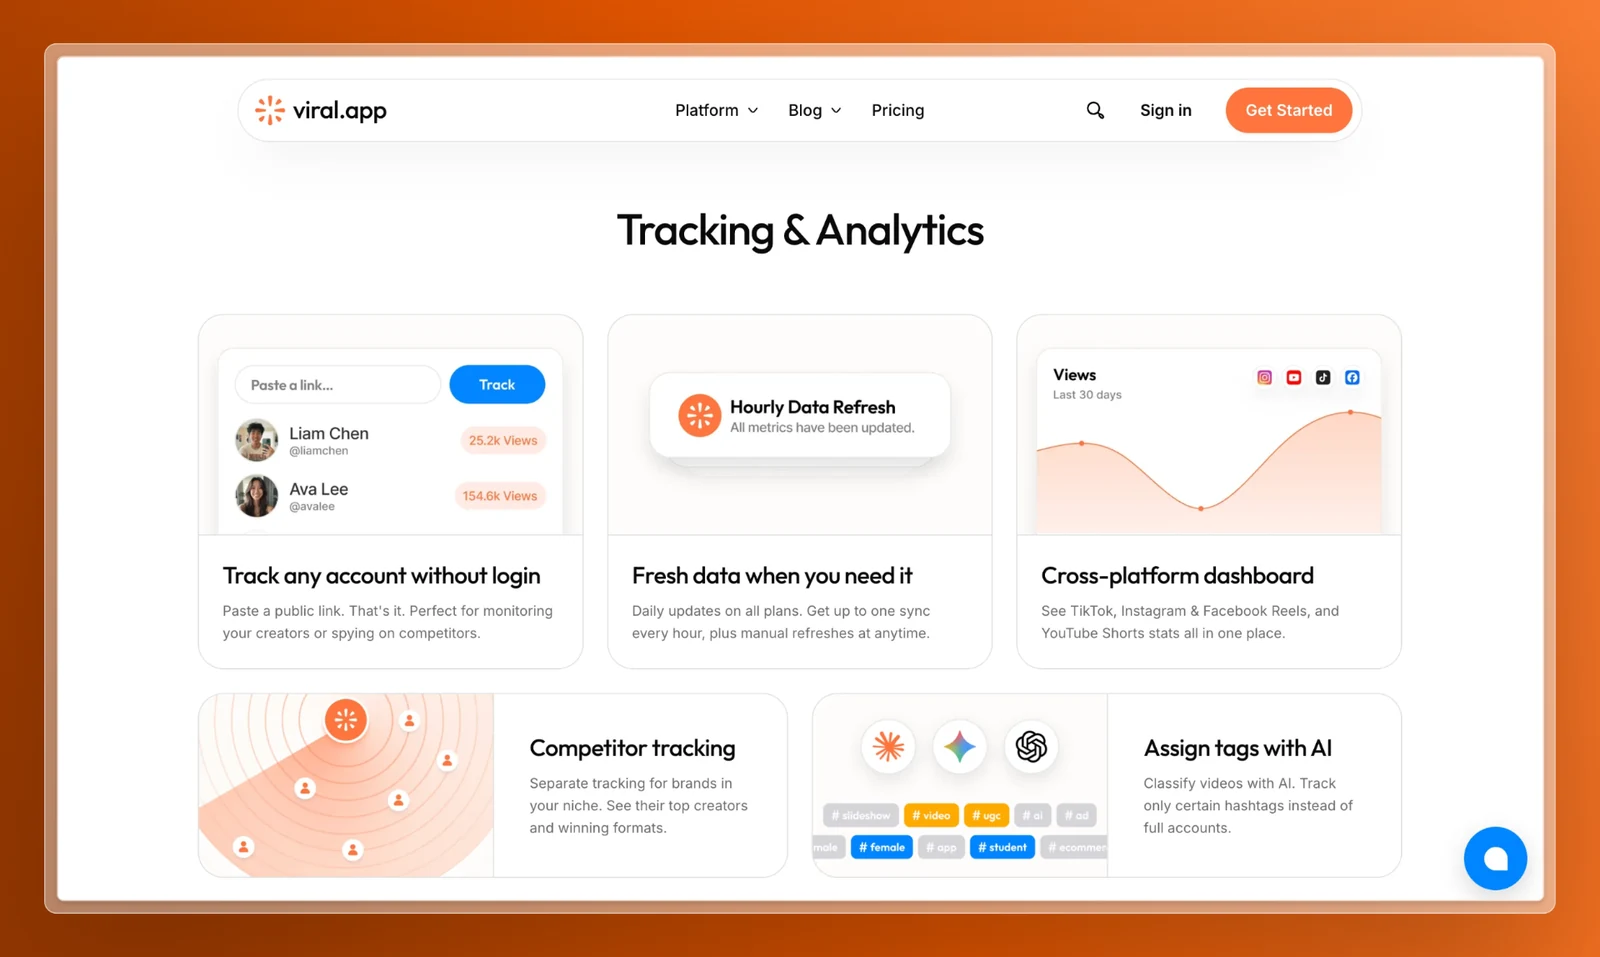
While AI dashboard tools revolutionize data visualization, having the right data is equally crucial. viral.app specializes in tracking and analyzing User-Generated Content performance across TikTok, Instagram, and YouTube—providing the rich dataset that makes AI-powered dashboards truly valuable.
Ready to combine powerful analytics data with AI-driven visualization? Start your free trial with viral.app and discover how comprehensive UGC tracking can transform your marketing insights!